The dashboard nobody is looking at
Prometheus alerting rules watch your metrics continuously and fire when a value crosses a line, and Alertmanager routes the resulting notification to email, chat, or a pager. Together they page you before an outage, so you learn about a problem from an alert instead of from a customer.
- An alert rule is a PromQL expression, a threshold, and a waiting period wrapped together.
- The for duration filters out transient spikes, so only sustained problems reach you.
- A severity label routes warnings and critical alerts to different channels.
- Alertmanager handles grouping, silencing, and delivery to email, chat, or a pager.
You have built something genuinely useful: metrics collected, stored, and queryable, ready to become dashboards. But a dashboard has a fatal flaw as a safety net. It only helps when someone is looking at it, and nobody is looking at 3 AM, or during lunch, or on the weekend, which is precisely when the disk fills and the service dies.
Monitoring that requires a human to be watching is not monitoring, it is a hobby.
The piece that makes it real is alerting: rules that watch your metrics continuously and reach out to you when something crosses a line, so you find out from a notification, before your users find out from an error page.
This chapter turns the queries from the last chapter into alert rules, and covers the two things that separate useful alerts from the noisy kind everyone learns to ignore.
Let's build.
Prerequisites
- Prometheus from the earlier parts running and scraping your targets.
- The PromQL expressions from part 3, which become the conditions for these alerts.
- Alertmanager installed if you want notifications delivered, not only alerts evaluated.
An alert is a query plus a threshold plus patience
An alert rule is mostly a PromQL expression, the same kind you already wrote, with a condition and a bit of patience attached. Define rules in a file Prometheus loads on your Ubuntu 24.04 LTS server:
groups:
  - name: node
    rules:
      - alert: HostOutOfDiskSpace
        expr: (node_filesystem_avail_bytes{mountpoint="/"} / node_filesystem_size_bytes{mountpoint="/"}) * 100 < 15
        for: 5m
        labels: { severity: warning }
        annotations:
          summary: "Less than 15% disk free on {{ $labels.instance }}"

      - alert: NodeDown
        expr: up{job="node"} == 0
        for: 2m
        labels: { severity: critical }
        annotations:
          summary: "node_exporter target is down"
Read one rule and you have them all. expr is a PromQL condition: the disk rule fires when free space on the root filesystem drops below 15%. for: 5m is the patience, and it is the most important line: the condition must stay true for five straight minutes before the alert actually fires. labels classify it (severity: warning versus critical), and annotations are the human-readable message, which can pull in labels like the instance name. Load the rules and Prometheus starts evaluating them on every scrape.
Confirm the rules are loaded and armed
Check that Prometheus has picked up your rules and is watching them:
curl -s http://127.0.0.1:9091/api/v1/rules
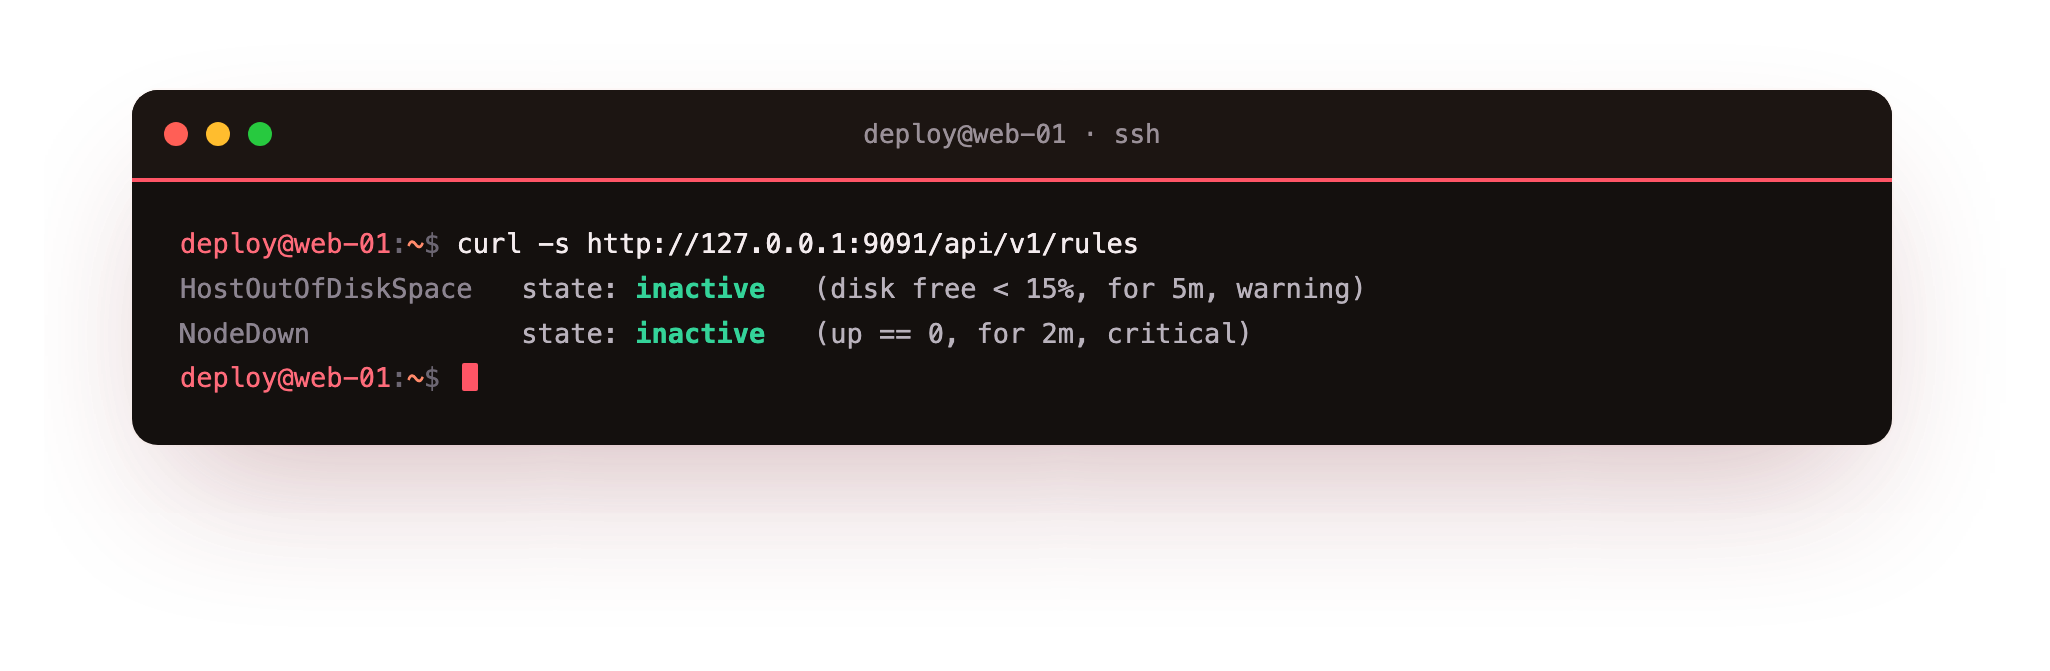
Both rules are loaded and their state is inactive, which is exactly what you want to see: inactive means the condition is not currently true, so the disk has plenty of space and the node is up. This is the healthy state.
When the disk crosses the threshold, that rule moves to pending (the condition is true but the for duration has not elapsed yet), and if it stays true past the five minutes, to firing, at which point the notification goes out.
Those three states, inactive, pending, firing, are the whole lifecycle of an alert, and being able to see them means you can watch a developing problem move through the stages rather than only hearing about it at the end.
What makes an alert useful instead of ignored?
Anyone can write alerts. Writing alerts people actually respond to is the real skill, and it comes down to two disciplines.
The for duration is what kills noise. Metrics are spiky. CPU hits 100% for three seconds constantly; the disk momentarily dips; a scrape occasionally blips. Without patience, every one of these would page you, and an alert that cries wolf is an alert everyone mutes, which means it is worse than no alert because it trains you to ignore the real one.
for: 5m says "only tell me if this is still a problem after five minutes," which filters out the transient spikes and leaves the genuine, sustained problems.
Tune it per alert: a filling disk can wait five minutes, but a server that has been unreachable for two minutes probably warrants a faster page. The NodeDown rule uses for: 2m for exactly that reason.
Severity decides how loudly it shouts. Not every alert deserves to wake you up. A disk at 85% is a warning: deal with it during working hours. A server that is completely unreachable is critical: page someone now. That severity label is what lets your notification system route them differently, a warning to a chat channel you check, a critical to a phone that rings.
Alerting fatigue is the death of monitoring, and matching the loudness of the alert to the actual urgency of the problem is how you avoid it. If everything is critical, nothing is.
Prometheus alerting rules and Alertmanager routing
Prometheus decides when an alert fires; a companion tool called Alertmanager decides where the notification goes and handles the human niceties: grouping related alerts so one incident is one message not fifty, silencing alerts during planned maintenance, and routing by those severity labels to email, Slack, Telegram, or a pager.
You point Prometheus at Alertmanager, configure a receiver (a webhook to your team's chat is the common starting point), and now a firing alert becomes a message in the place you will actually see it.
For a small setup, a single Alertmanager routing critical alerts to a phone-notifying channel and warnings to a general channel covers almost everything you need.
The good alerts to start with are the ones that catch the failures these guides kept warning about: disk filling (it always fills eventually), a service or target down (the up == 0 check), memory nearly exhausted, and, for your app specifically, an error rate climbing or the health endpoint failing. A handful of well-chosen alerts with sensible for durations and honest severities will catch the large majority of real incidents before a user ever notices.
Troubleshooting alert rules
The rules do not appear in /api/v1/rules. Prometheus is not loading the file. Add its path under rule_files in the main config and reload the service.
An alert is stuck in pending. The condition is true but the for duration has not elapsed yet. It moves to firing once the window passes.
An alert fires but no notification arrives. Prometheus evaluates the rules; Alertmanager delivers them. Confirm Prometheus points at a running Alertmanager and that a receiver is configured.
Brief spikes keep paging you. The for duration is too short or missing. Raise it so a momentary blip clears before the alert fires.
Frequently asked questions
Where do alert rules live?
In a rules file that you reference under rule_files in the Prometheus config. Prometheus evaluates every rule on each scrape.
What is the difference between pending and firing?
pending means the condition is true but the for duration has not passed. firing means it stayed true long enough, so the notification goes out.
Do I need Alertmanager?
Prometheus can evaluate rules on its own, but Alertmanager is what turns a firing alert into an email, chat message, or page, and it handles grouping and silencing.
What you have built
Step back and look at the whole series. You started with a server that was silent, one that would surprise you with an outage you learned about from a customer. You now have node_exporter publishing its vital signs, Prometheus scraping and storing the history, PromQL to turn raw metrics into real answers, and alert rules that watch those answers continuously and reach out before a problem becomes an outage. Every command ran on one small VPS.
That is observability you own: your server is no longer a black box, it tells you how it is doing, keeps a history you can question, and taps you on the shoulder before it falls over. Combined with the rest of these guides, you now have infrastructure that is hardened, deployed properly, backed up and restorable, and watched. That is the full stack of running your own servers well, and it is a set of skills that does not expire, whether you run one box or a hundred.