The gap between a number and an answer
PromQL is Prometheus's query language, and this chapter uses it to write the handful of queries you reach for constantly: memory used, disk full, and CPU busy. A few PromQL patterns turn raw metrics into answers you can actually read.
- PromQL does arithmetic on metrics, so available over total becomes a memory-used percentage.
- Label filters such as {mountpoint="/"} point a query at one specific series out of many.
- rate() turns an ever-increasing counter like CPU seconds into a per-second rate you can read.
- Aggregation functions like avg and sum collapse many series into the single number you want.
Prometheus has been storing metrics like node_memory_MemAvailable_bytes for a few chapters now. That is a number of bytes, and it is not what you actually want to know. You want "what percentage of my memory is in use," "how full is the disk," "how busy has the CPU been this last minute."
The gap between the raw metric and the human question is bridged by PromQL, Prometheus's query language, and learning a handful of PromQL patterns is what turns a pile of numbers into a monitoring system you can reason with.
You do not need to master it. You need about five queries, and this chapter builds the ones you will use constantly.
Let's build.
Prerequisites
- Prometheus from part 2 running and scraping node_exporter on your server.
- The Prometheus HTTP API reachable locally, at 127.0.0.1:9091 on this box.
- Comfort with curl, since a query is just an HTTP request carrying the expression as a parameter.
Querying, and a percentage worth having
You can run a query against Prometheus's API on your Ubuntu 24.04 LTS server and get an answer back. The most useful first query is memory usage as a percentage, because "1.3 GB available" means nothing without knowing the total, but "34% used" is instantly meaningful. You compute it from two metrics, available over total:
curl -s http://127.0.0.1:9091/api/v1/query \
  --data-urlencode 'query=100 * (1 - node_memory_MemAvailable_bytes / node_memory_MemTotal_bytes)'
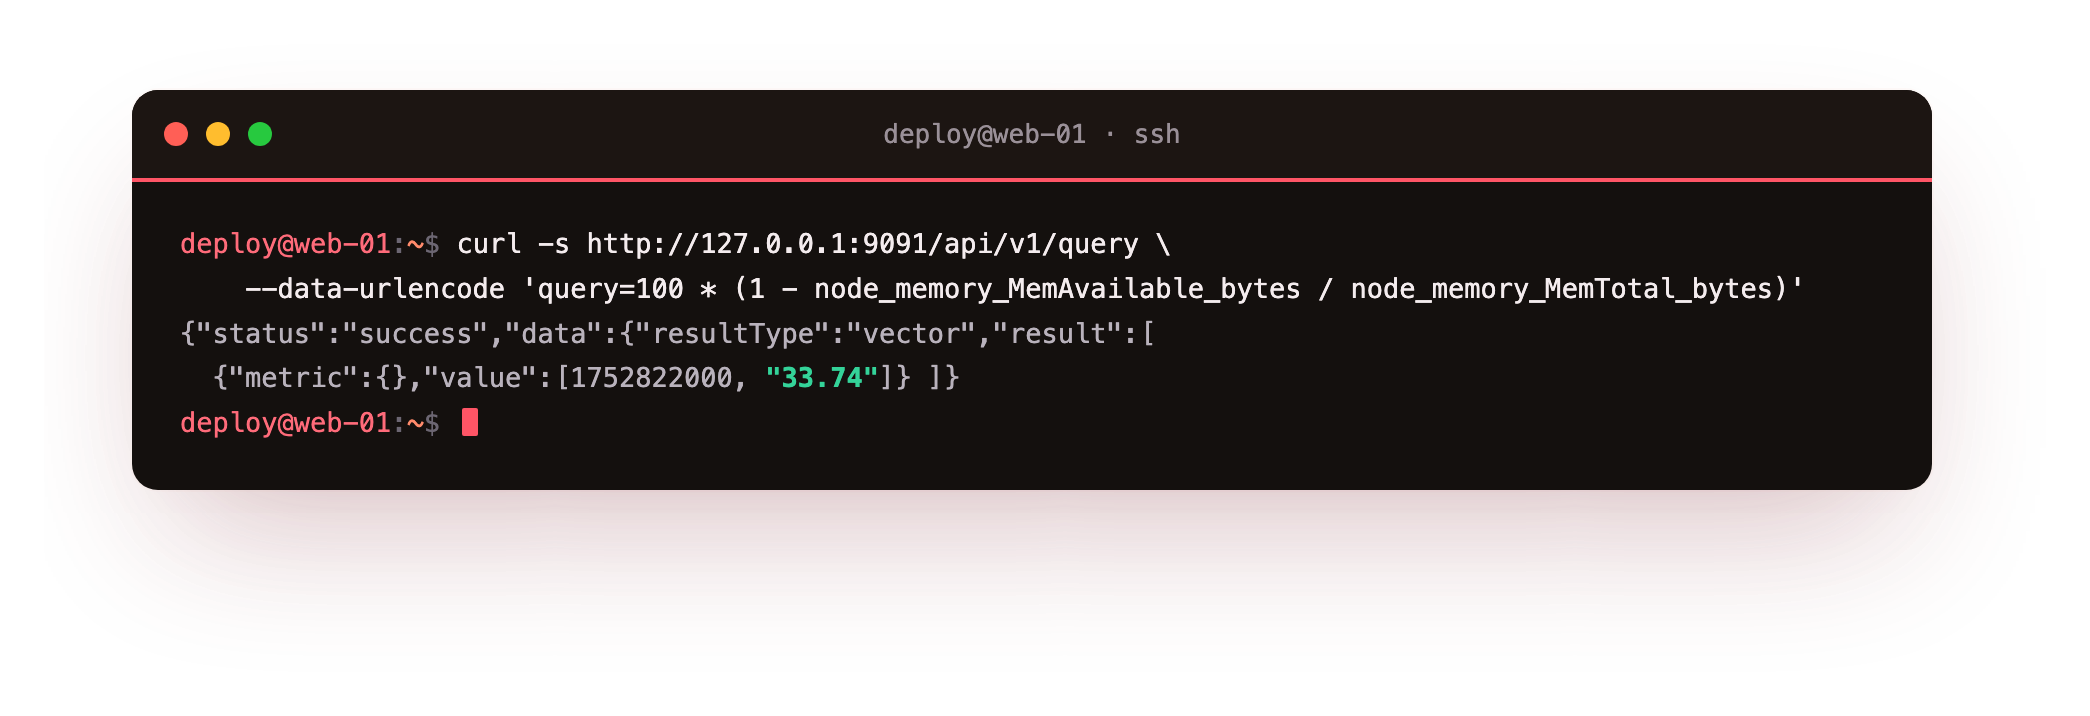
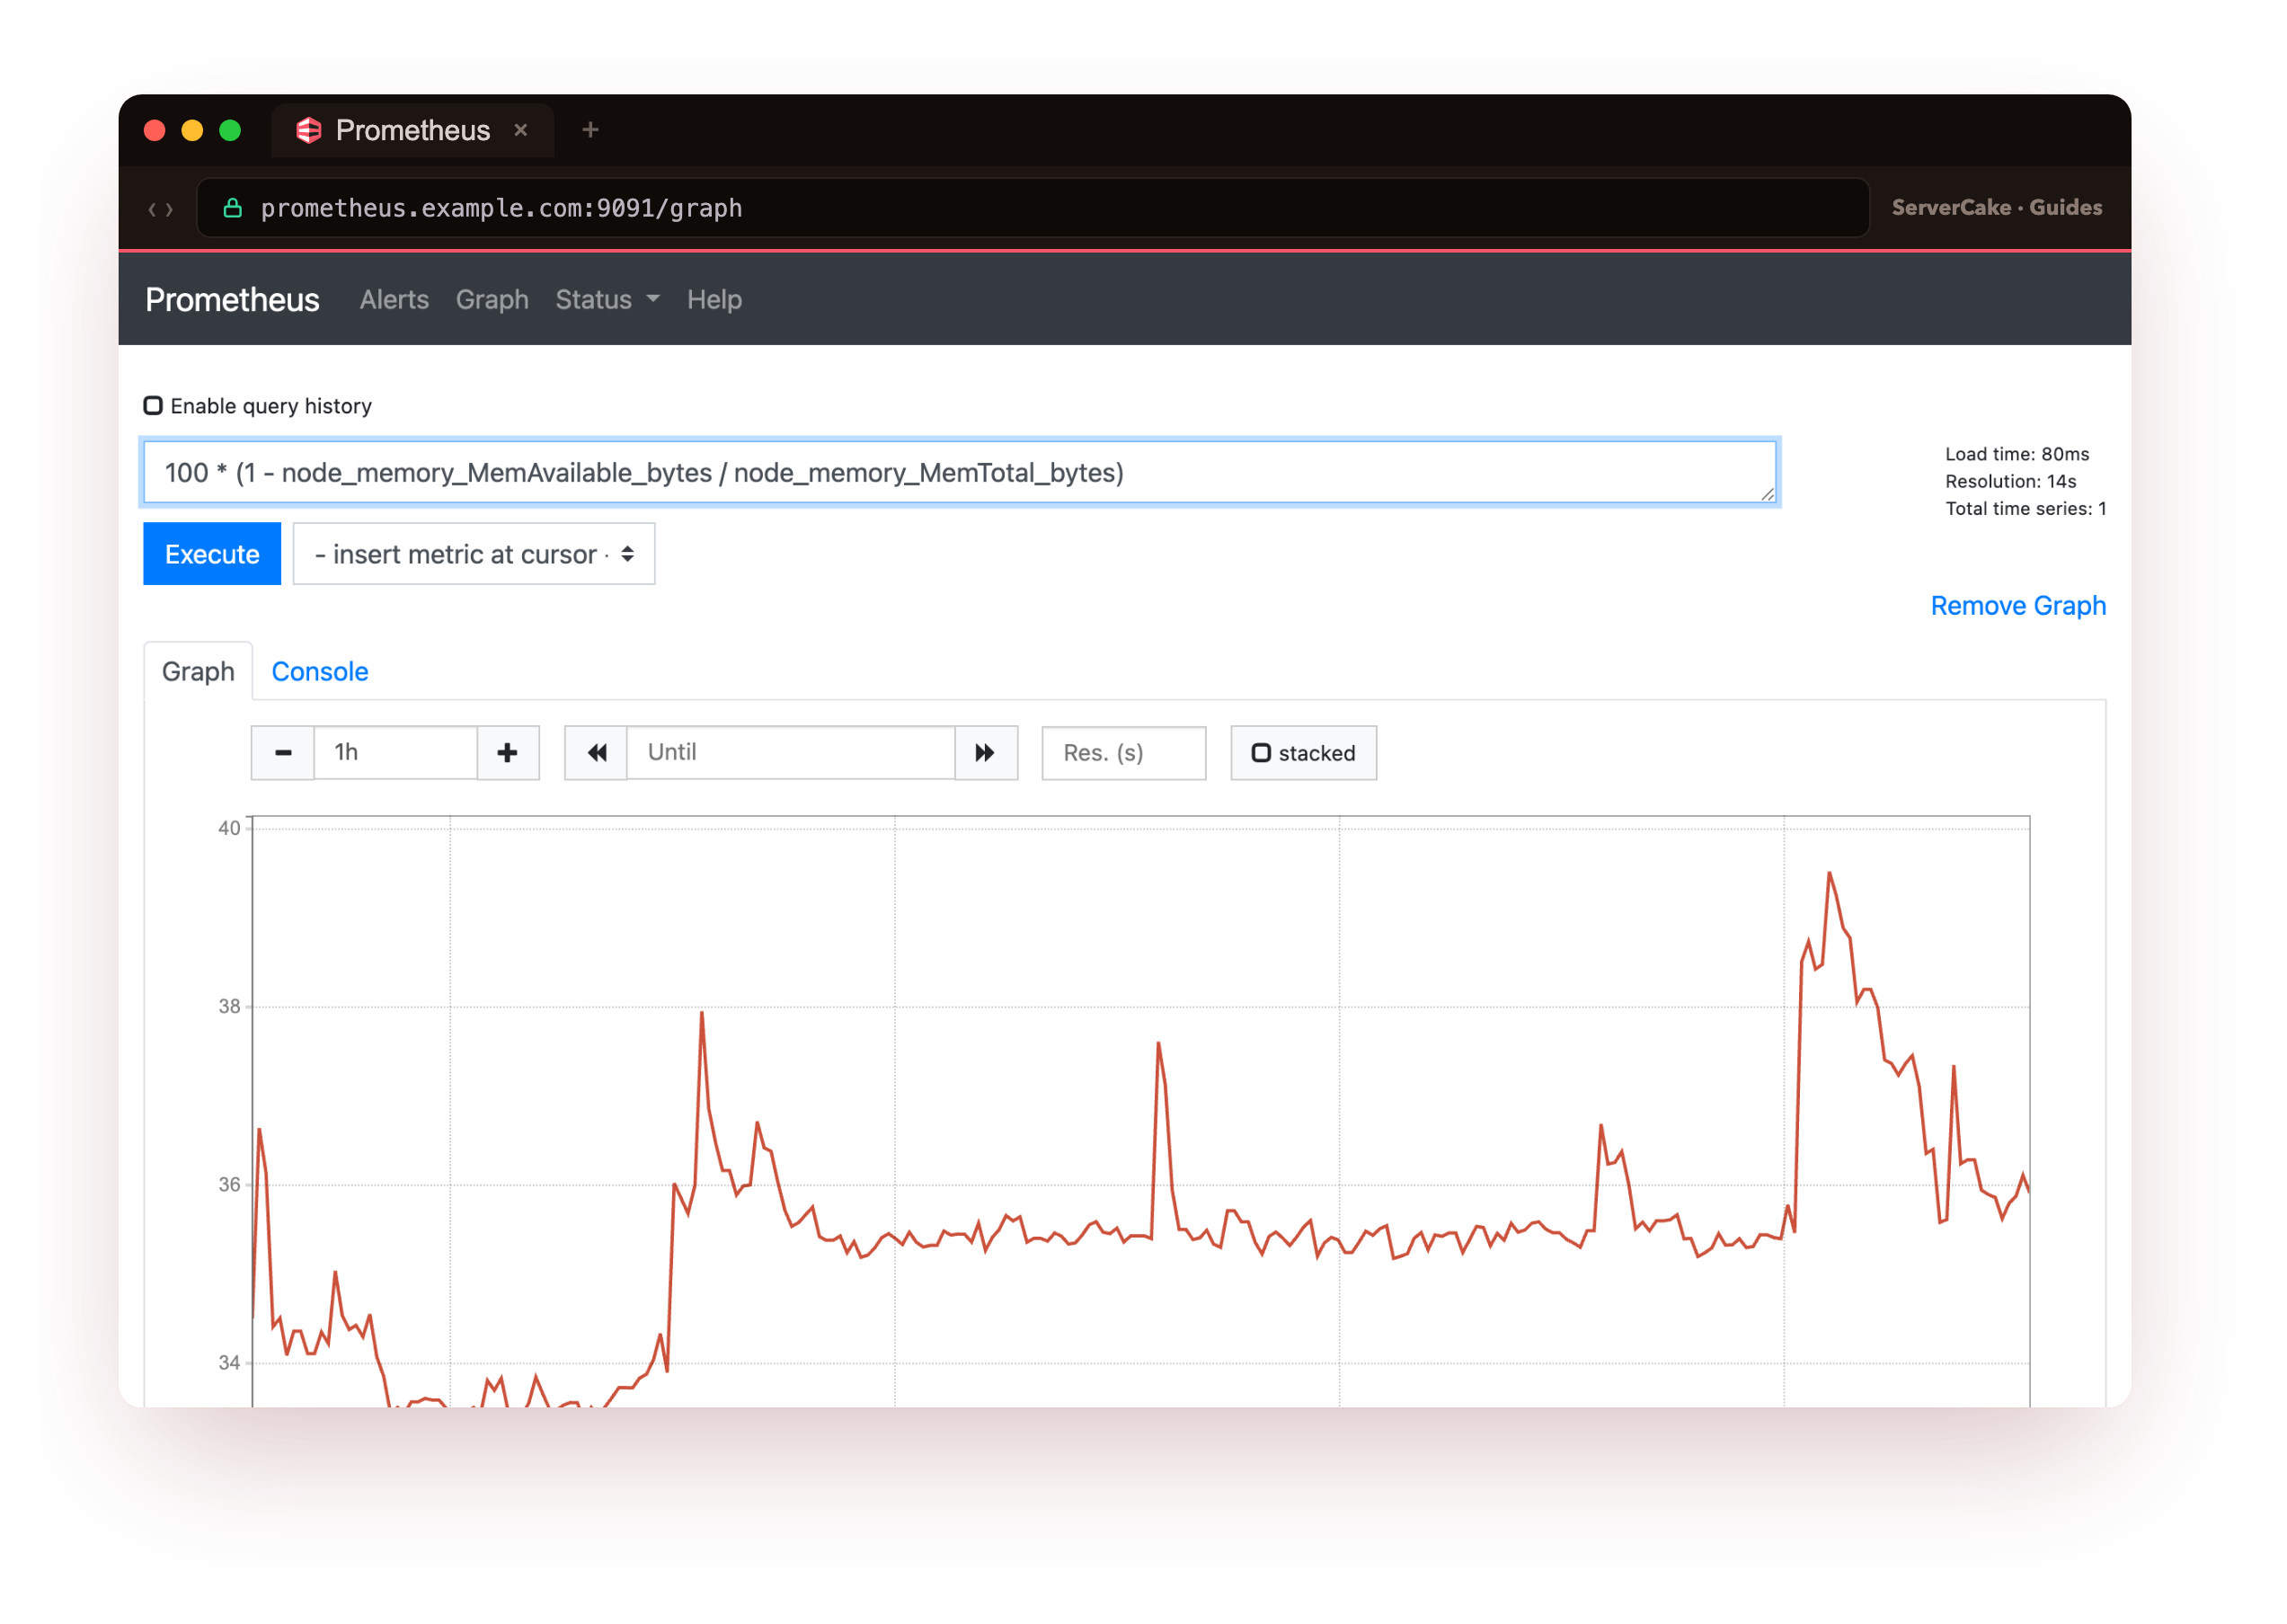
The answer comes back: about 33.7% of memory in use. That query shows the core move in PromQL: you do arithmetic on metrics. node_memory_MemAvailable_bytes / node_memory_MemTotal_bytes is the fraction available, 1 - that is the fraction used, and 100 * turns it into a percentage. Metrics are just numbers, so you add, subtract, multiply, and divide them exactly as you would expect, and the result is a new number that answers your question. Disk is the identical pattern on a different metric:
100 * (1 - node_filesystem_avail_bytes{mountpoint="/"} / node_filesystem_size_bytes{mountpoint="/"})
That returns about 11.3% of the root disk used. Notice the {mountpoint="/"} label filter: it narrows the metric to the root filesystem, because a server has several and you want a specific one. Label filtering is how you point a query at exactly the thing you mean, and you will use it constantly.
rate(): the query that makes counters useful
Memory and disk are gauges, values that go up and down, and you read them directly. CPU is different, and it trips up everyone at first. The CPU metric, node_cpu_seconds_total, is a counter: it only ever increases, counting the total seconds the CPU has spent in each mode since boot.
Its raw value ("the CPU has spent 4 million seconds idle") is useless. What you want is the rate of change: how fast is it climbing right now, which tells you how busy the CPU is. That is what rate() does:
100 * (1 - avg(rate(node_cpu_seconds_total{mode="idle"}[1m])))
Read it inside out. rate(node_cpu_seconds_total{mode="idle"}[1m]) is how fast the idle-seconds counter grew over the last minute, which is the fraction of time the CPU was idle. avg(...) averages across the server's cores. 1 - that is the fraction busy, and 100 * makes it a percentage, here about 31%.
rate() over a time window is the single most important PromQL function, because so many important metrics, CPU, network bytes, request counts, errors, are ever-increasing counters that only mean something as a rate. The moment you see a _total metric, reach for rate().
aggregation: from many series to one number
That query also quietly used aggregation. A server has multiple CPU cores, so node_cpu_seconds_total is not one series but many, one per core per mode, and avg() collapsed them into a single number. Aggregation operators, avg, sum, max, min, count, are how you go from many time series to the one answer you want.
sum(rate(...)) totals across everything; max by (instance) (...) gives the worst value per server across a fleet. When you eventually monitor several servers, aggregation is what lets you ask "the highest disk usage across all my machines" in one query instead of checking each by hand.
The PromQL queries for memory, disk, and CPU
You now have the whole toolkit, and in practice it collapses to a small set of patterns you will reach for over and over:
- Memory used %:
100 * (1 - node_memory_MemAvailable_bytes / node_memory_MemTotal_bytes) - Disk used %:
100 * (1 - node_filesystem_avail_bytes{mountpoint="/"} / node_filesystem_size_bytes{mountpoint="/"}) - CPU busy %:
100 * (1 - avg(rate(node_cpu_seconds_total{mode="idle"}[1m]))) - Is a target up?:
up{job="node"}(1 for up, 0 for down) - Load average:
node_load1
That is genuinely most of what you will type. Everything else is a variation: a different metric, a different label filter, a different aggregation. You do not need the depth of PromQL to run a solid monitoring setup; you need these shapes and the confidence that when a new question comes up, it is the same moves on a different metric.
Where do these queries live?
You have been running queries by hand to learn them, but you will not do that day to day. These exact expressions become the panels on a Grafana dashboard, where the memory query is a gauge, the CPU query is a graph over time, and the disk query turns red past a threshold.
Grafana points at your Prometheus, you paste in a PromQL expression per panel, and you have the live dashboard you actually watch.
And the very same expressions, as the next chapter shows, become the conditions for alerts, so the query that draws your disk-usage graph is also the one that pages you before the disk fills.
Troubleshooting your queries
A query returns an empty result. A metric name or a label is wrong. Check the exact spelling, and confirm the mountpoint or job label matches what your exporter actually publishes.
rate() returns nothing. rate() needs a counter and a window that spans at least two samples. Apply it only to _total counters and give it a range like [1m] that covers several scrape intervals.
curl reports a parse error on the query. The expression was not URL-encoded. Pass it with --data-urlencode so spaces and braces survive the request intact.
The percentage looks inverted. These metrics report available space, not used. Used percent is 100 * (1 - available / total), so drop the 1 - and you get free percent instead.
Frequently asked questions
What is the difference between a gauge and a counter?
A gauge rises and falls and you read it directly, like free memory. A counter only increases, like total CPU seconds, and is meaningful only once you take its rate.
Why [1m] and not a longer window?
The window sets how much history rate() averages over. One minute reacts quickly to a change; a longer window is smoother but slower to reflect a sudden spike.
Do I have to memorise PromQL?
No. The patterns for memory, disk, CPU, and up cover most daily monitoring. A new question is usually the same shape applied to a different metric and label.
What you have, and the last piece
You can now turn raw metrics into real answers: usage percentages for memory and disk, CPU busyness with rate(), and single numbers out of many series with aggregation. That is the core skill of this whole stack, and it is a small, learnable set of patterns rather than a language you have to master.
But even a good dashboard only helps when someone is looking at it, and nobody watches a dashboard at 3 AM. The final chapter closes that gap: turning these same queries into alert rules, so that instead of you watching for the disk to fill or a service to die, Prometheus watches, and tells you, before your users are the ones who notice.