The outage you find out about from a customer
node_exporter is the Prometheus component that reads your Ubuntu server's CPU, memory, disk, and load, then publishes them as Prometheus metrics over HTTP. In this chapter you install it and read the raw numbers yourself.
- node_exporter installs from apt and immediately publishes hundreds of server metrics on port 9100.
- A metric is a named number with labels, sampled over time, which is what lets you see trends and leaks.
- The metrics are plain text over HTTP, so you can read them yourself with a single curl.
- Prometheus uses a pull model: a central server scrapes each exporter rather than servers pushing data out.
A server that you cannot see inside is a server that surprises you. The disk fills at 3 AM and the first you hear of it is an app throwing write errors. Memory creeps up over a week and one afternoon the out-of-memory killer takes down your database.
The CPU has been pinned at 100% for an hour and you only notice because the site got slow enough for a customer to email. Every one of these had warning signs, and every one was invisible because nobody was measuring.
The opposite of that surprise is observability: your server continuously reporting what it is doing, so you can see a problem building instead of discovering it after it lands.
The foundation of observability is metrics: numbers, sampled over time. How much memory is free right now, and a minute ago, and an hour ago. This series builds a real metrics stack on a live Ubuntu 24.04 LTS server, and it starts where all metrics start, with the thing that produces them: an exporter that reads your server's vital signs and publishes them.
Let's build.
Prerequisites
- An Ubuntu 24.04 LTS server you can reach over SSH.
- A user with sudo, so you can install packages with apt.
- A firewall in front of the box (see the Linux server hardening guide) so port 9100 never faces the internet.
What is a metric, actually?
A metric is a named number with labels, sampled repeatedly over time. node_memory_MemAvailable_bytes is a metric: available memory, in bytes, right now. Sample it every fifteen seconds and you have a time series, the same number across time, which is what lets you see trends, spikes, and slow leaks rather than just a single instant.
That time dimension is the whole point. A single reading of "1.3 GB free" tells you almost nothing; the same number plotted over a day tells you whether memory is stable, climbing toward a crash, or spiking with traffic.
The labels matter too. node_filesystem_avail_bytes{mountpoint="/"} is available space on the root filesystem specifically, and the {mountpoint="/"} label is how you ask about one disk out of several. Labels are what turn a flat number into something you can slice and question, which the PromQL chapter leans on heavily.
node_exporter: Prometheus metrics from your server
The tool that reads a Linux server's metrics and publishes them is node_exporter, part of the Prometheus ecosystem. It exposes hundreds of metrics, CPU, memory, disk, filesystem, network, load, and it does one job: read them from the kernel and serve them over HTTP for something to collect. Install it:
sudo apt install prometheus-node-exporter
It starts as a service listening on port 9100, and, exactly like every other service in these guides, you keep it on localhost and behind your firewall; Prometheus will scrape it locally, and nothing external needs to reach it. That is the whole install: your server is now producing metrics.
Look at the raw metrics
The metrics are just text served over HTTP, and you can read them directly, which is worth doing once to demystify the whole thing. Fetch a few:
curl -s http://127.0.0.1:9100/metrics | grep -E "node_load1|node_memory_MemAvailable_bytes"
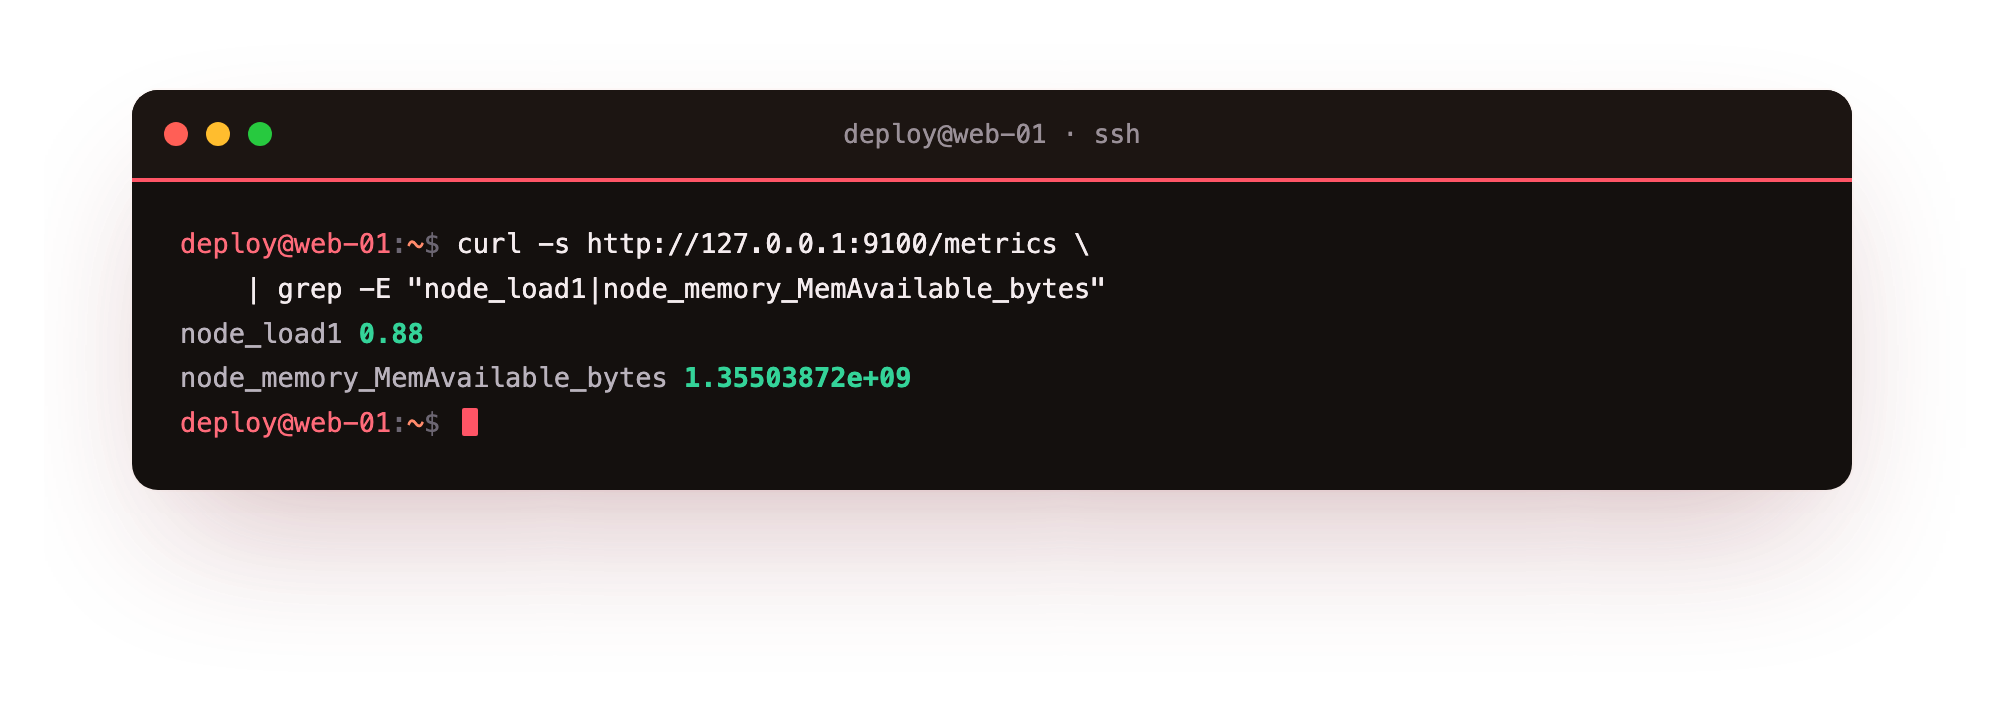
There they are, in plain text: node_load1 is the system load average over one minute, and node_memory_MemAvailable_bytes is the available memory in bytes (about 1.35 billion, so 1.3 GB free on this box). Each line is a metric name, its labels, and its current value. That is all a metric is: a number you can read.
node_exporter is publishing hundreds of these, updated live, and the disk one you will care about most, node_filesystem_avail_bytes{mountpoint="/"}, shows about 36 GB free on the root disk. Nothing magic, just your server's vital signs, exposed for the taking.
Why this format, and why pull
You might notice node_exporter does not send its metrics anywhere; it just publishes them and waits to be asked. This is the Prometheus model, and it is a pull model: a central Prometheus server periodically scrapes each exporter by fetching that /metrics URL, rather than each server pushing data out.
It seems backwards until you see the advantages. The thing being monitored stays dead simple, it just exposes numbers, with no config about where to send them. The monitoring server has one list of what to scrape, so adding or removing a target is one edit in one place.
And "is this target up?" becomes a free health check: if a scrape fails, Prometheus knows immediately the server is unreachable, which, as the alerting chapter shows, is one of the most valuable signals you get.
This is also why the format is deliberately boring text. Any service can expose Prometheus metrics by serving that same simple format on a /metrics endpoint, and most modern tools do: your database, your web server, your own application with a few lines of a client library. node_exporter covers the server itself; the same pull-and-scrape mechanism then collects metrics from everything else you run, all in one place.
Troubleshooting node_exporter
curl http://127.0.0.1:9100/metrics returns "Connection refused." The service is not running, or it is bound to a different address. Run systemctl status prometheus-node-exporter and confirm it is active and listening on 9100.
apt install reports the package is not found. Your package index is stale. Run sudo apt update first, then install again.
The grep finds no matching lines. node_exporter is running but a metric name differs between versions. Drop the grep and read the full output to see the exact names your version publishes.
Frequently asked questions
Does node_exporter slow my server down?
No. It reads counters the kernel already keeps and serves them only when scraped, so the overhead on a normal server is negligible.
What is the difference between node_exporter and Prometheus?
node_exporter reads and publishes one server's metrics and nothing else. Prometheus is the separate server that scrapes those metrics on a schedule and stores their history.
Can I publish metrics from my own application too?
Yes. Any service that serves the same plain text format on a /metrics endpoint can be scraped, and client libraries exist for most languages to expose it in a few lines.
What you have, and what comes next
Your server is now observable at the source: node_exporter is publishing hundreds of live metrics about CPU, memory, disk, and more, and you have read them with your own eyes to see they are nothing but named numbers. That is the raw material of monitoring.
But raw metrics served on a port are not yet monitoring. Nobody is collecting them, storing their history, or watching them over time, so right now the numbers vanish the instant after you curl them. The next chapter installs Prometheus, the server that scrapes these metrics every few seconds, stores their history, and turns a live-only reading into a queryable record of how your server has behaved over hours, days, and weeks.