From live numbers to a history you can question
Prometheus is the server that collects your metrics: it runs a scrape against each exporter on an interval set in one config file, and its targets view confirms every endpoint is being read successfully.
- Prometheus is a single server process, installed from apt, driven entirely by one config file.
- scrape_configs lists each target as host:port, so adding a target is one edit in that file.
- The targets API reports every endpoint as up or down, which doubles as a live health check.
- Prometheus keeps roughly fifteen days of history by default, enough to spot trends and recent incidents.
Last chapter left you with node_exporter publishing live metrics on a port, and a problem: nobody is collecting them. Curl the endpoint and you see this instant's numbers; look away and they are gone.
Monitoring needs memory, a record of how your server behaved over time, so you can see that memory has been climbing all week or that the disk crossed 80% yesterday. Prometheus is the piece that provides it: a server that scrapes your exporters every few seconds, stores every sample with its timestamp, and lets you query the whole history.
This chapter installs Prometheus on Ubuntu 24.04 LTS, points it at your exporter, and confirms it is collecting.
Let's build.
Prerequisites
- node_exporter from part 1 running and publishing on 127.0.0.1:9100.
- An Ubuntu 24.04 LTS server with sudo, to install the prometheus package.
- A free local port for Prometheus itself, 9090 by default and 9091 on this box.
The Prometheus scrape config and its targets
Prometheus is a single server process, installable from the package manager:
sudo apt install prometheus
Its entire behaviour is driven by one config file that lists what to scrape and how often. This is the heart of the pull model: Prometheus holds the list, so adding a target is one edit here rather than reconfiguring the target itself. A minimal config scrapes node_exporter and Prometheus's own metrics:
global:
  scrape_interval: 15s

scrape_configs:
  - job_name: node
    static_configs:
      - targets: ['127.0.0.1:9100']
  - job_name: prometheus
    static_configs:
      - targets: ['127.0.0.1:9091']
scrape_interval: 15s means Prometheus fetches every target's /metrics every fifteen seconds and stores what it finds. Each job_name groups related targets, and targets is the list of host:port endpoints to scrape. Here, node is the node_exporter from the last chapter and prometheus is Prometheus watching itself, which is a good habit: your monitoring should monitor its own health too. Restart Prometheus to load the config, and it begins collecting.
One practical note from a real server: Prometheus defaults to port 9090, which on this box was already taken by another service, so it was moved to 9091 with a listen-address setting. Port collisions like that are exactly the kind of thing you discover on a real machine and not in a tutorial, and the fix is a one-line argument.
Confirm it is actually collecting
The first thing to check after setting up any scraper is whether its targets are healthy, because a target that is misconfigured or unreachable is silently collecting nothing, which you do not want to discover during an incident. Prometheus exposes this over its own API:
curl -s 'http://127.0.0.1:9091/api/v1/targets?state=active'
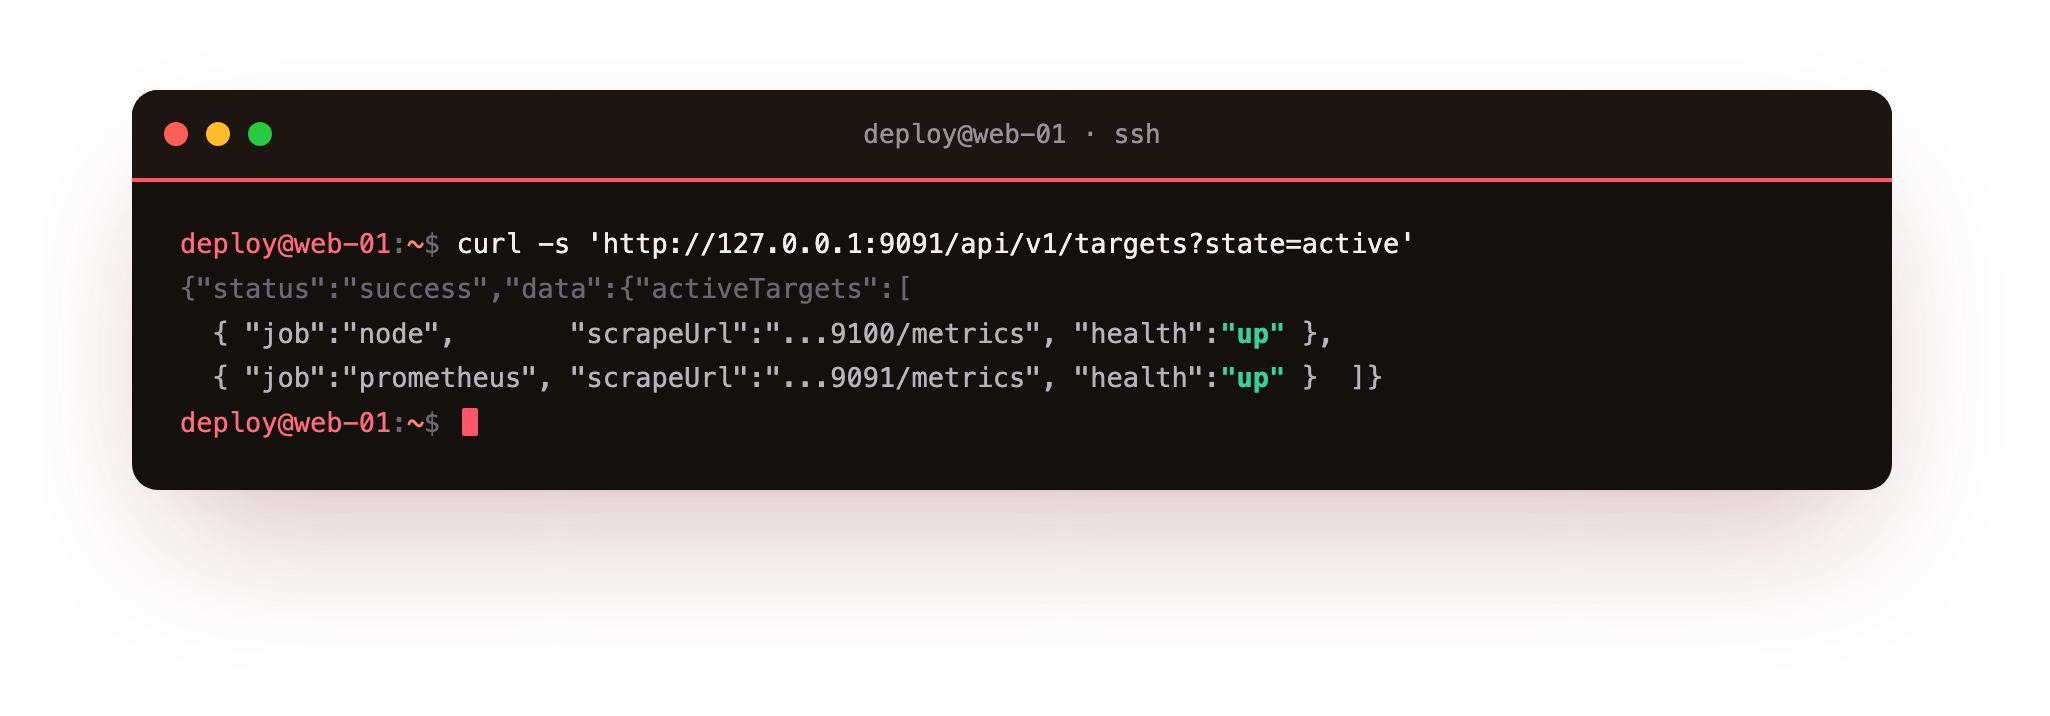
Both targets report up: the node job and the prometheus job are being scraped successfully. That single word, up, is doing a lot of work. It means Prometheus reached the endpoint, got valid metrics, and is storing them, and it is also itself a metric you can alert on.
If node_exporter crashed or the server went unreachable, this would flip to down, and that transition is one of the most valuable alerts you can have, because "I can't even reach the server" is usually the first sign of real trouble.
When a target shows as down, the same view tells you why, a connection refused, a timeout, so you are debugging with information rather than guessing.
What is Prometheus doing under the hood?
Every fifteen seconds, Prometheus fetches each target's metrics and appends every value, with a timestamp and its labels, to its time-series database on disk. Over a day that is thousands of samples per metric; over a week, tens of thousands, and Prometheus is built to store and query them efficiently.
This accumulating history is the whole value: you are no longer looking at "memory is 33% now," you are able to ask "what has memory done over the last six hours," which is the difference between reacting and seeing something coming.
By default Prometheus keeps this history for about fifteen days, which is plenty for spotting trends and investigating recent incidents, and you can extend it if you want a longer record. It is worth knowing Prometheus is designed for exactly this kind of operational metric data, recent, high-resolution, queryable, and not as a permanent archive; for long-term storage people pair it with other tools, but for keeping an eye on your servers, the built-in retention is more than enough.
Troubleshooting the scrape
A target shows down with "connection refused." Nothing is listening at that host:port. Confirm node_exporter is running and that the address in the config matches where it listens.
Prometheus will not start after you edit the config. The YAML is invalid, usually an indentation slip. Check the service logs with journalctl to see the exact parse error and line.
Prometheus fails to bind its own port. Another service already holds 9090. Start Prometheus with a different --web.listen-address, as this box does on 9091.
A config change does not take effect. Prometheus reads the file when it starts, so reload or restart the service after editing before you expect new targets to appear.
The web console and where you are heading
Prometheus ships with a basic web interface on its port where you can type a query and see the result as a number or a simple graph, which is handy for exploring. But you will not stare at Prometheus's own UI day to day.
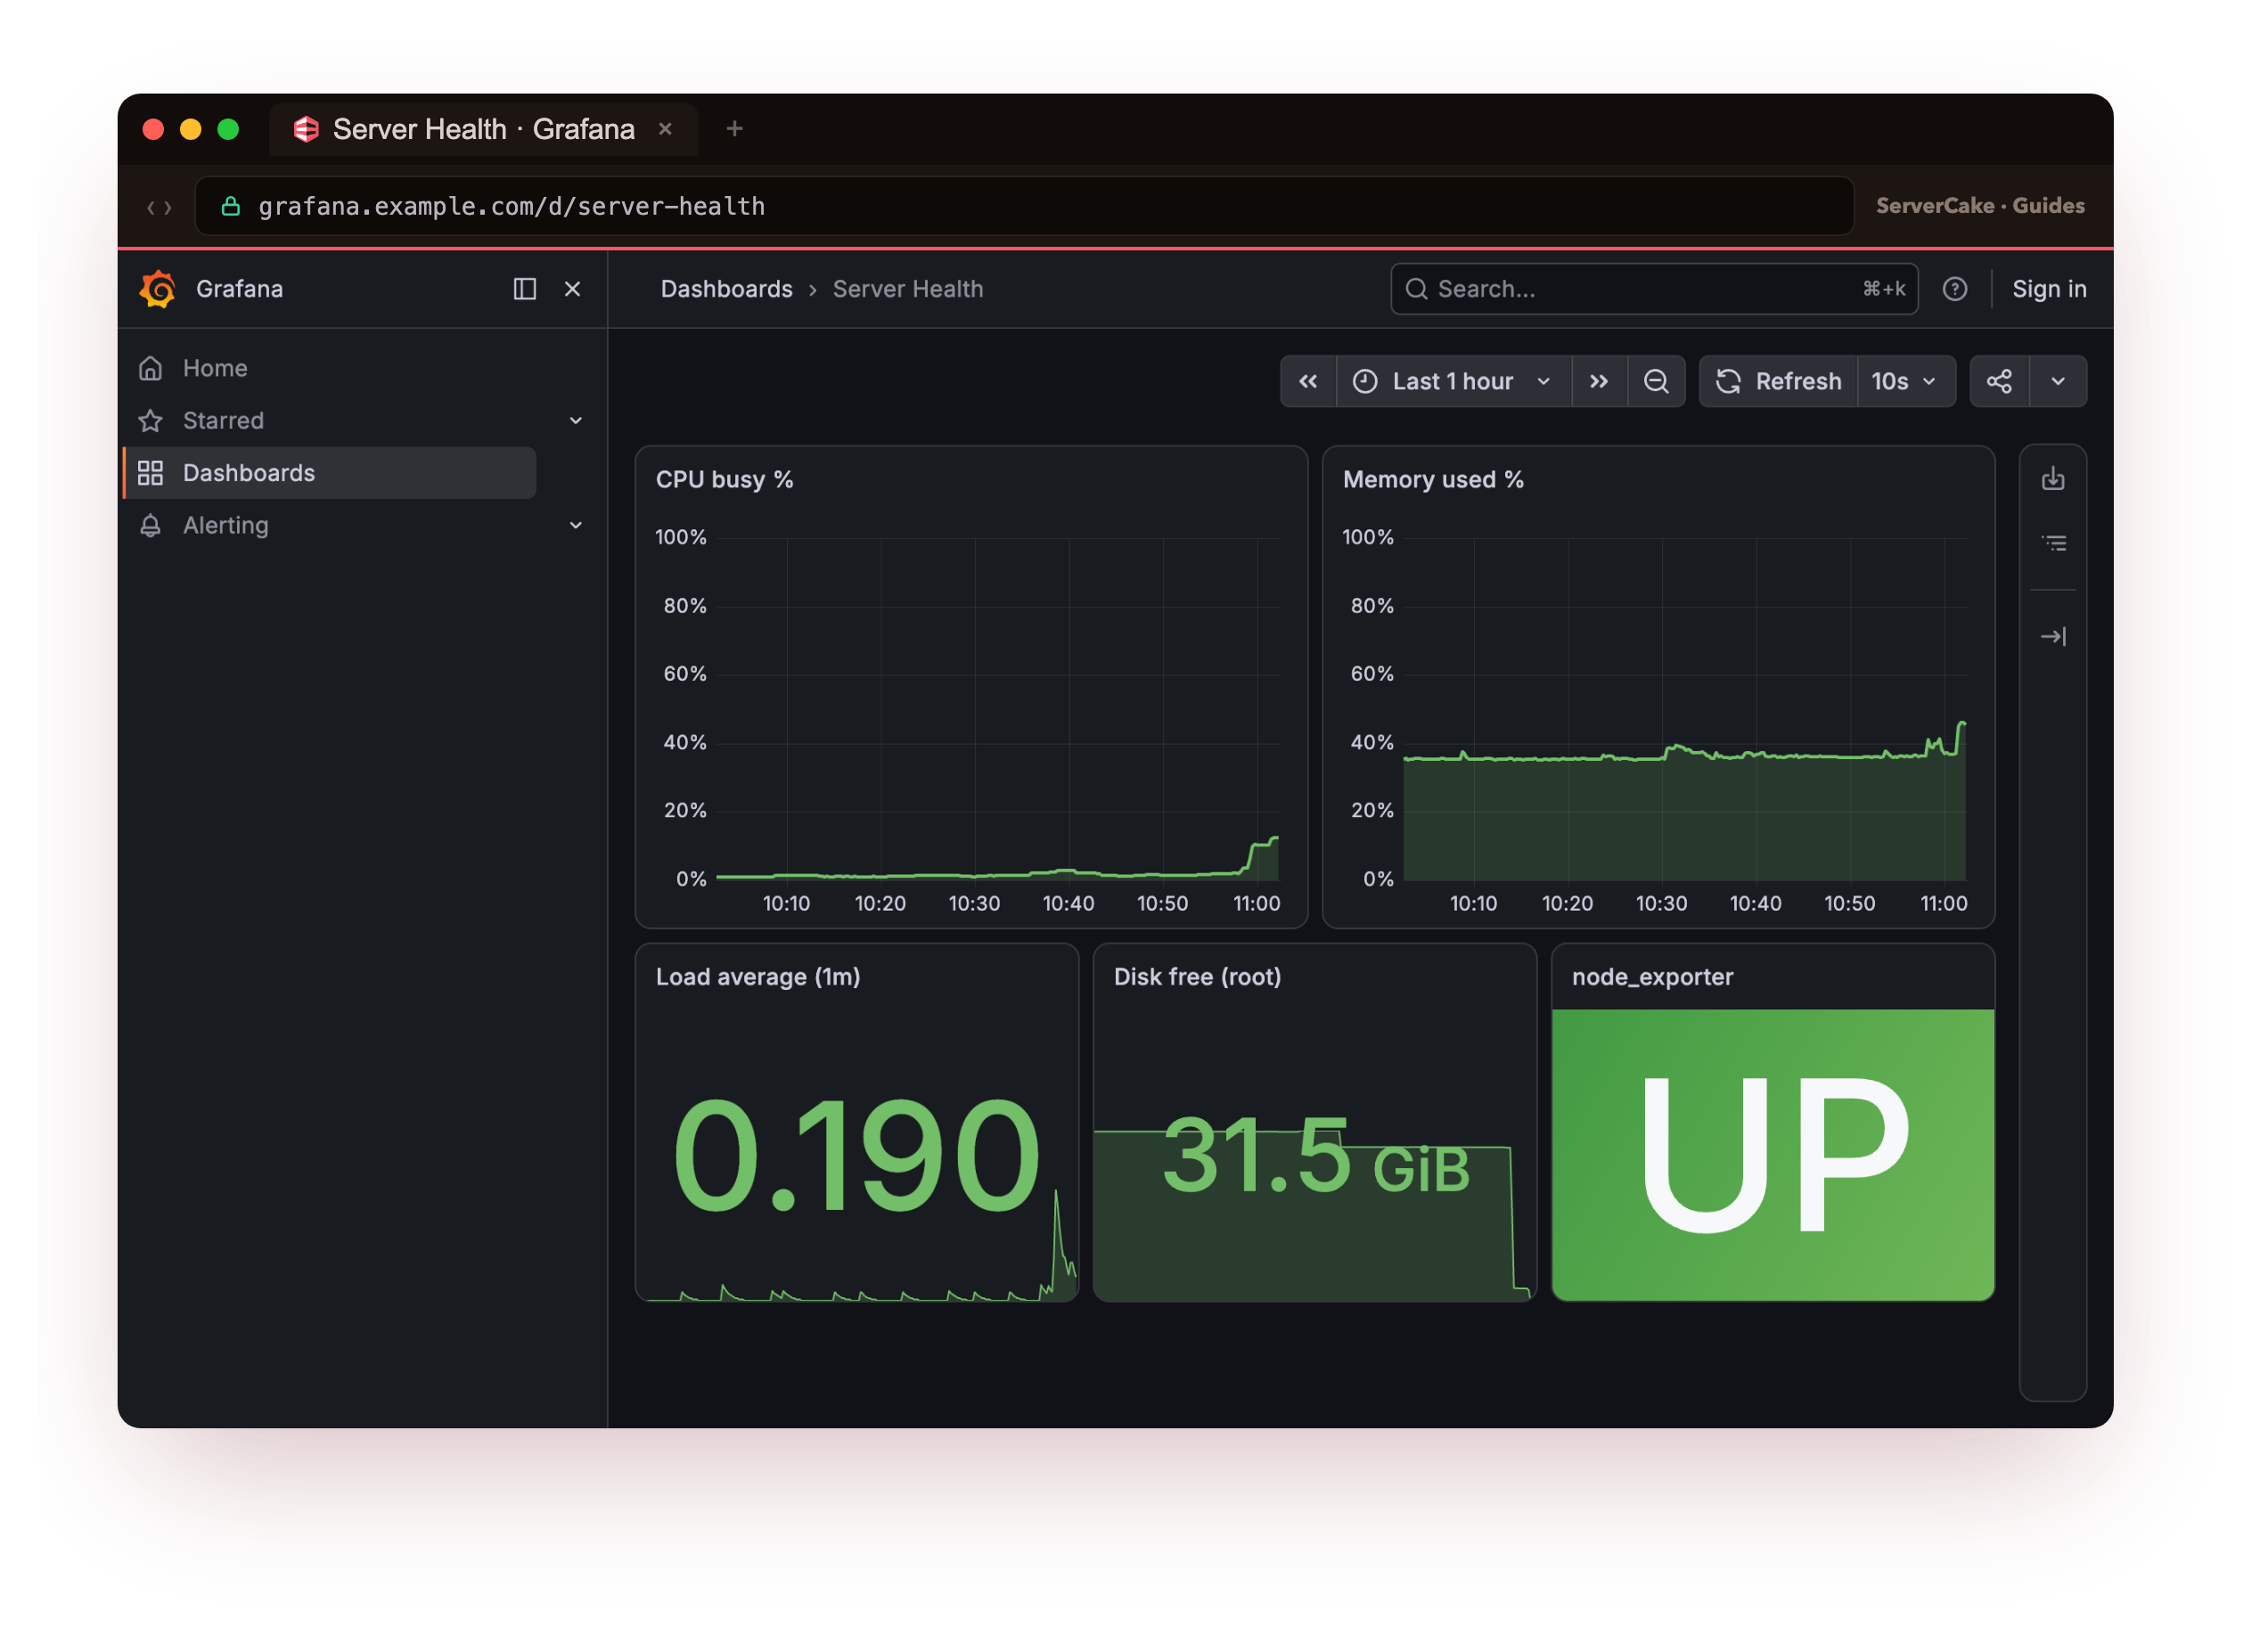
The usual setup is Prometheus doing the collecting and storing, and Grafana, a dashboard tool that reads from Prometheus, doing the visualising: the graphs of CPU and memory and traffic you actually watch.
Grafana is a single install that points at your Prometheus as a data source and turns these metrics into dashboards, and it is the natural next step once you are comfortable with the metrics themselves.
But dashboards are only as good as your ability to ask the right question, and that skill is PromQL, the query language that turns raw metrics into answers like "what percentage of memory is in use" or "how busy has the CPU been this minute." That is the real power of this stack, and it is the next chapter.
Frequently asked questions
How often should Prometheus scrape?
Fifteen seconds is a common default and suits most servers. A shorter interval gives finer resolution at the cost of more storage and more load on your targets.
Where does Prometheus store the data?
In a local time-series database on disk, a directory of compressed blocks. Back up or mount that directory separately if the history matters to you.
Can one Prometheus scrape many servers?
Yes. Add each exporter as another entry under scrape_configs, and a single Prometheus collects from your whole fleet into one queryable store.
What you have, and what comes next
You now have a real collection pipeline: Prometheus scraping your exporter every fifteen seconds, storing the history on disk, with both targets confirmed healthy. Your server's behaviour is being recorded, not just glimpsed, and you have the up signal that tells you the instant a target goes dark.
But a database full of raw metrics is not yet an answer to a question. node_memory_MemAvailable_bytes is a number of bytes; you want "how full is my memory, as a percentage, and is it trending up." Turning stored metrics into questions like that is what PromQL does, and the next chapter uses it to ask the handful of questions you will reach for again and again.