The database that is slow for no reason
PostgreSQL tuning and monitoring on a small VPS means sizing its memory to the RAM you actually have, then using the database's own tools to find the queries that cost the most. This chapter does both on a live 1.9 GB server so a modest box gets faster without an upgrade.
- PostgreSQL's defaults assume a tiny machine, so a capable server runs slow until you size its memory.
- shared_buffers at about 25% of RAM and effective_cache_size at 50 to 75% do most of the tuning work.
- effective_cache_size allocates no memory; it only stops the planner from avoiding indexes out of caution.
- pg_stat_statements ranks queries by total time, so you fix the expensive ones instead of the ones you happened to notice.
PostgreSQL ships with settings designed to start on almost anything, including a laptop from fifteen years ago. That is a fine default for "will it run." It is a terrible default for "is it using the server I paid for." Out of the box, PostgreSQL assumes it has a tiny slice of memory and behaves accordingly, which means a database on a capable server can be slow purely because nobody told it the server exists.
The good news is that the settings that matter most are few, and you can reason about them from one number: your RAM. This chapter sizes PostgreSQL to a real 1.9 GB VPS running Ubuntu 24.04 LTS, then finds the actual slow query using the database's own instrumentation, because tuning config without measuring queries is guessing with extra steps. Do both and you get a database that is fast on hardware you did not have to upgrade.
Let's build.
Prerequisites
- PostgreSQL 16 on Ubuntu 24.04 LTS, and the amount of RAM the server has (this guide sizes a 1.9 GB VPS).
- Permission to edit postgresql.conf, or a drop-in file, and to restart PostgreSQL for shared_buffers and pg_stat_statements.
- A database with real data and a workload to measure (this guide uses orders and customers tables).
- superuser (postgres) access to run EXPLAIN, CREATE EXTENSION, and read the pg_stat views.
Why are the defaults leaving performance on the floor?
Look at the four memory settings that decide most of your performance:
sudo -u postgres psql -c "SELECT name, setting, unit FROM pg_settings WHERE name IN ('shared_buffers','effective_cache_size','work_mem','maintenance_work_mem') ORDER BY name;"
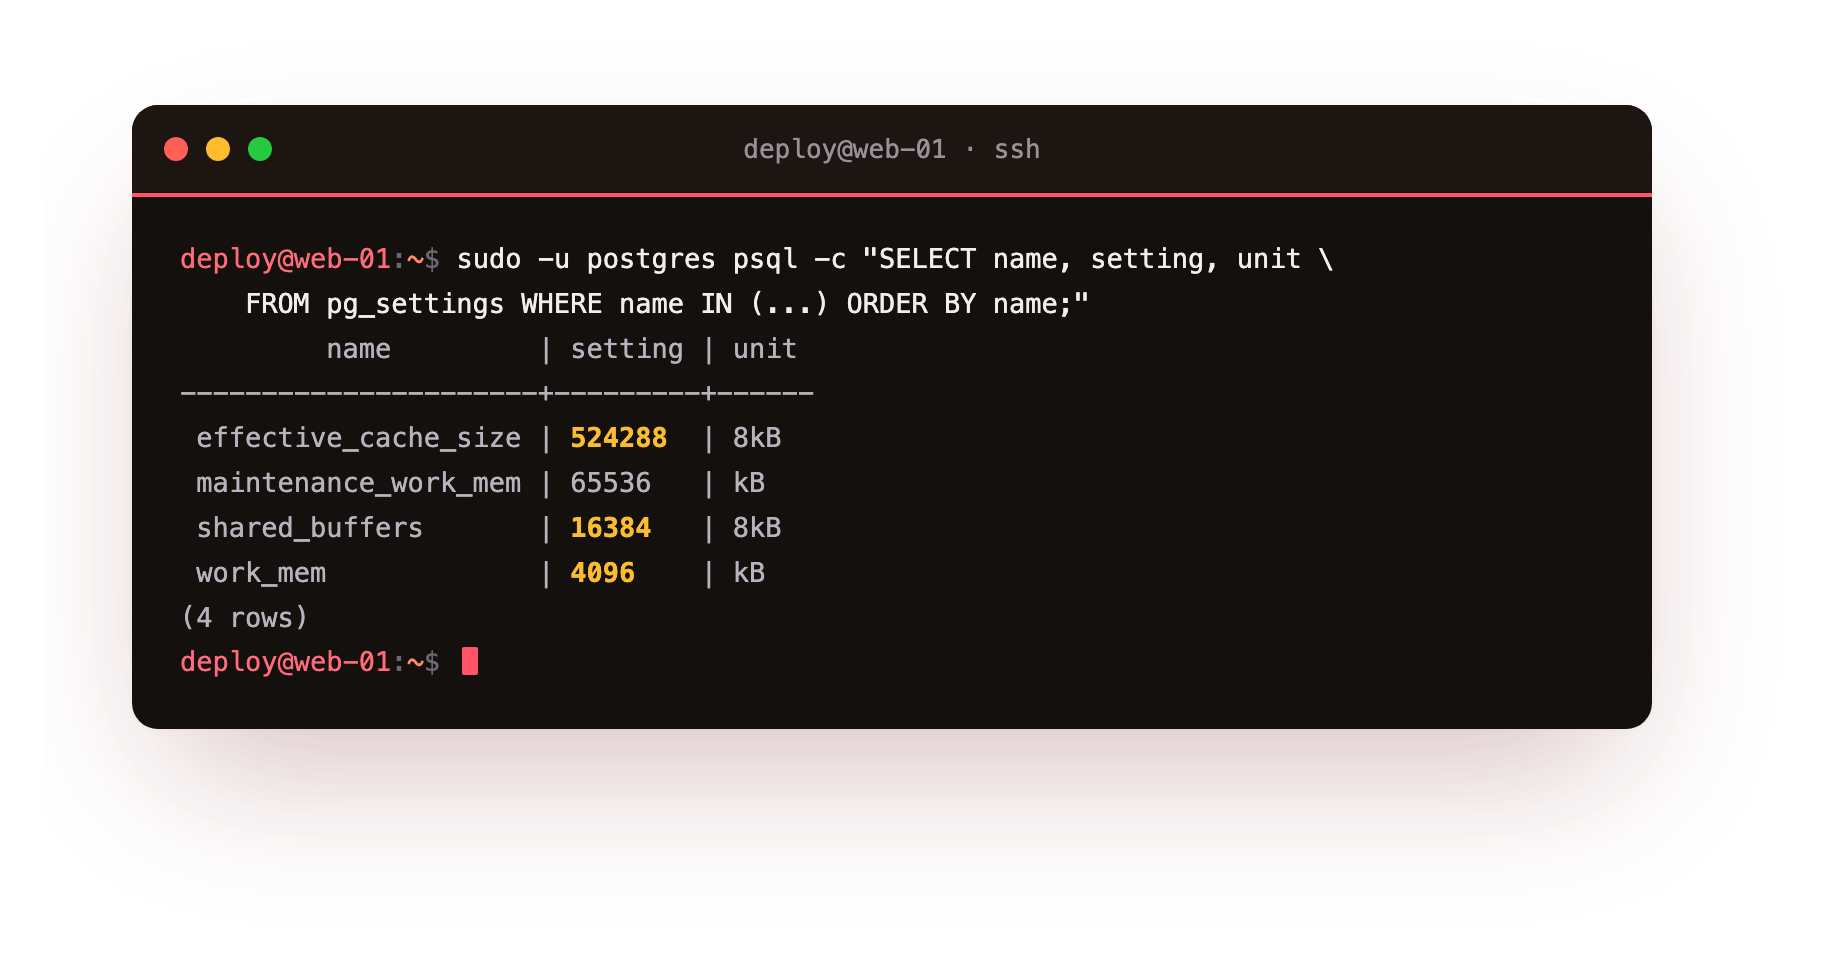
Read those in real units and the problem jumps out. shared_buffers is 16384 eight-kilobyte blocks, which is 128 MB, the cache PostgreSQL uses for data it is actively working with. work_mem is 4 MB, the memory each sort or hash can use before it spills to disk. On a 1.9 GB server these are conservative to a fault. The database is caching a fraction of what it could and pushing sorts to disk that would fit comfortably in memory.
Four settings, sized to your RAM
Here is a sane starting point for this server, and the reasoning, because you should never paste tuning numbers you cannot defend:
shared_buffers= ~25% of RAM. On 1.9 GB, set it to512MB. This is PostgreSQL's own cache of table and index data. A quarter of RAM is the long-standing rule; more is rarely worth it because the operating system also caches your files.effective_cache_size= ~50 to 75% of RAM, say1200MB. This one changes nothing about memory allocation. It is a hint that tells the query planner how much cache is likely available, which makes it correctly prefer index scans over sequential scans. Setting it too low makes the planner pessimistic and slow.work_mem= small and careful,8MBhere. This is per sort, per hash, per connection, so the real cost iswork_memtimes your concurrency. With a pool of 20 from the last chapter,8MBis safe; raising it to64MBon a busy server is how people accidentally run themselves out of memory. Raise it deliberately, for specific heavy reporting queries, not globally.maintenance_work_mem= generous,256MB. This is used by one-off operations likeCREATE INDEXandVACUUM, which do not run per connection, so you can afford to give them room and make them much faster.
Set these in postgresql.conf (or a drop-in), restart, and the same hardware does noticeably more work. The single highest-leverage change is usually effective_cache_size, because it costs no memory and it stops the planner from choosing slow plans out of misplaced caution.
Do not guess which query is slow. Ask the database.
Config is half the job. The other half is the queries, and here intuition is worse than useless because the query that feels slow is rarely the one costing you the most. A query that takes 5 milliseconds but runs ten thousand times an hour hurts far more than a report that takes two seconds once a day. You need data, and PostgreSQL collects it for you. The whole server needs metrics and monitoring of its own; this chapter starts with the data the database keeps on itself.
Start with a single query and ask the planner exactly what it does. EXPLAIN (ANALYZE, BUFFERS) runs the query and reports the real plan, the real row counts, and how much data it touched:
EXPLAIN (ANALYZE, BUFFERS)
SELECT c.city, count(*) AS orders
FROM orders o JOIN customers c ON c.id = o.customer_id
WHERE o.placed_at > now() - interval '30 days'
GROUP BY c.city ORDER BY orders DESC;
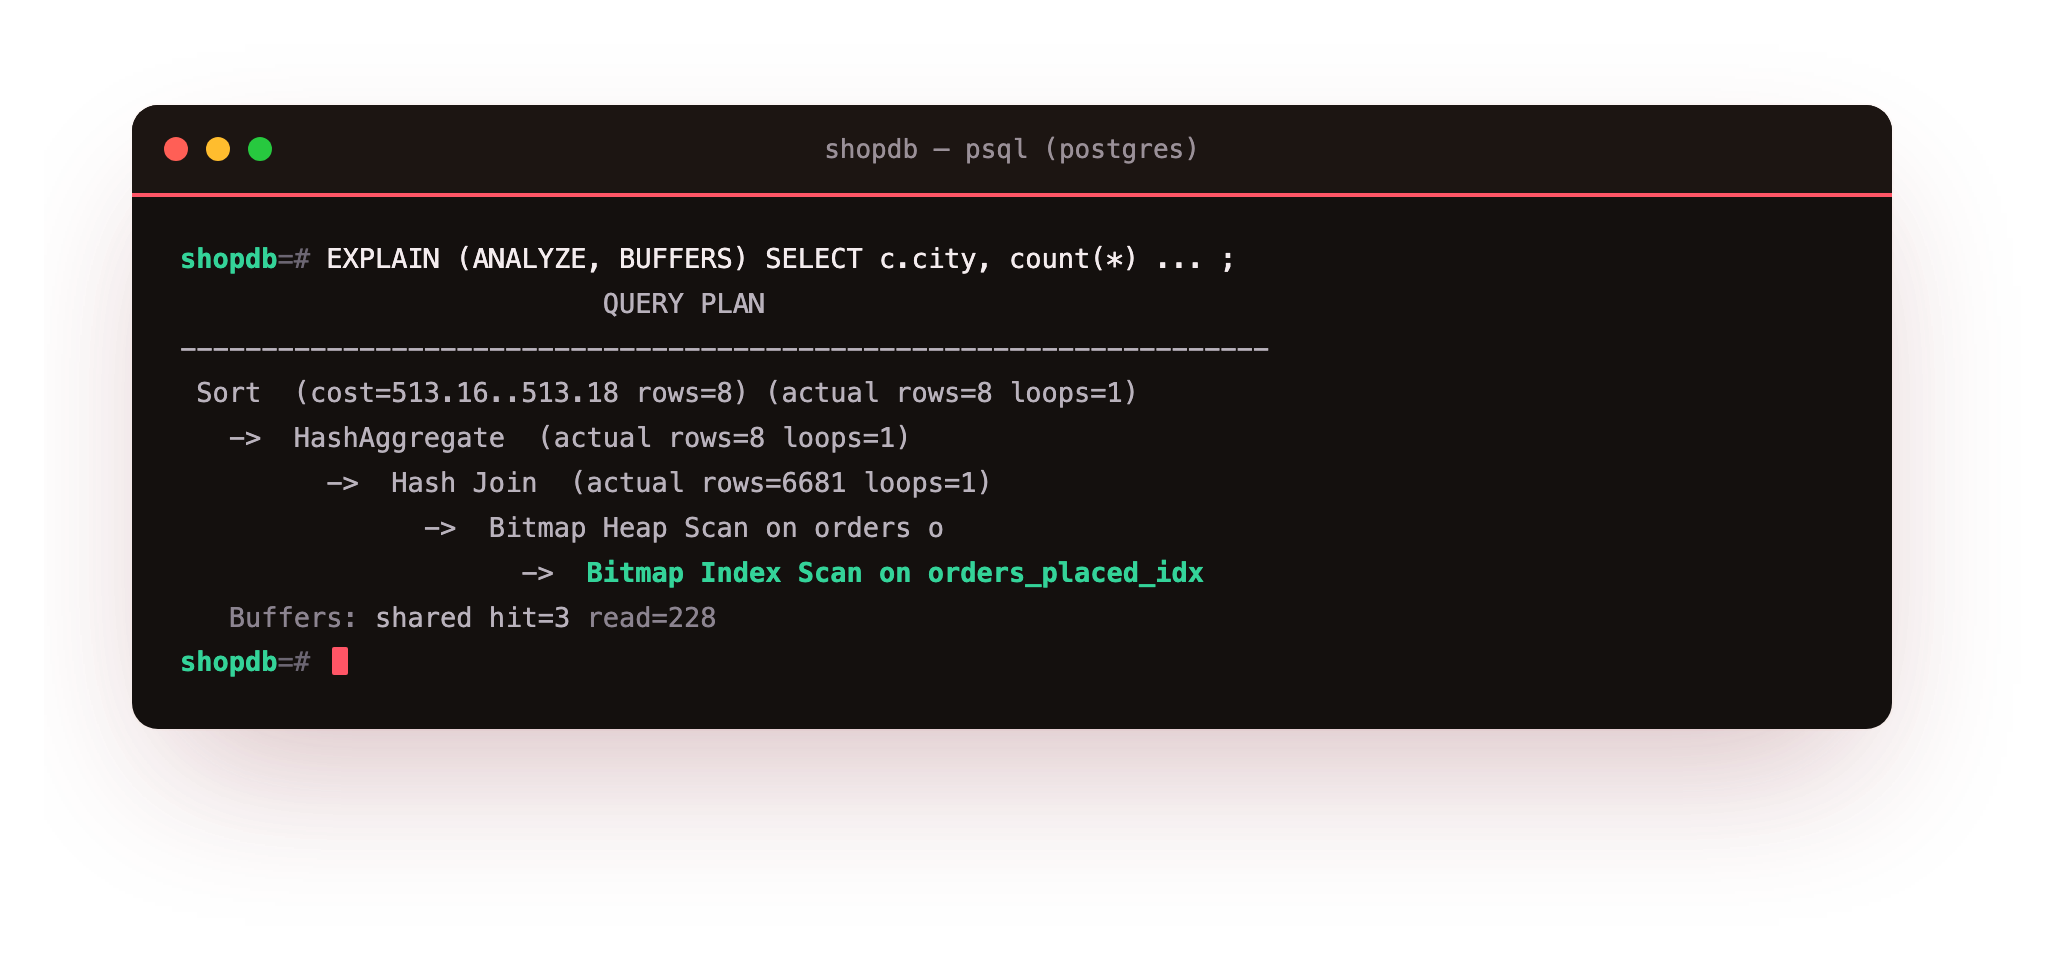
Read that plan from the inside out and it tells a good story. The Bitmap Index Scan on orders_placed_idx means PostgreSQL used the index we created on placed_at instead of scanning all twenty thousand orders, which is exactly what you want.
The Buffers: shared read=228 line is the tell to watch: it is how many blocks the query pulled, and it is your unit of "how expensive." When you add an index and the buffer count drops, you have proof the index helped, not a feeling. If instead you see a Seq Scan on a large table with a big buffer count and a WHERE clause that should have used an index, you have found something worth fixing.
Find the worst queries automatically
Running EXPLAIN on one query is useful. Knowing which queries to run it on is the real skill, and pg_stat_statements answers it. It is an extension that records every query your database runs and totals up how much time each one has consumed. Enable it once (it needs to be preloaded and the server restarted), then it quietly watches everything:
CREATE EXTENSION IF NOT EXISTS pg_stat_statements;
Now ask it for the queries that have cost the most total time, which is the number that actually matters for your server's load:
SELECT calls,
       round(total_exec_time::numeric, 1) AS total_ms,
       round(mean_exec_time::numeric, 2)  AS mean_ms,
       left(query, 48) AS query
FROM pg_stat_statements
ORDER BY total_exec_time DESC
LIMIT 5;
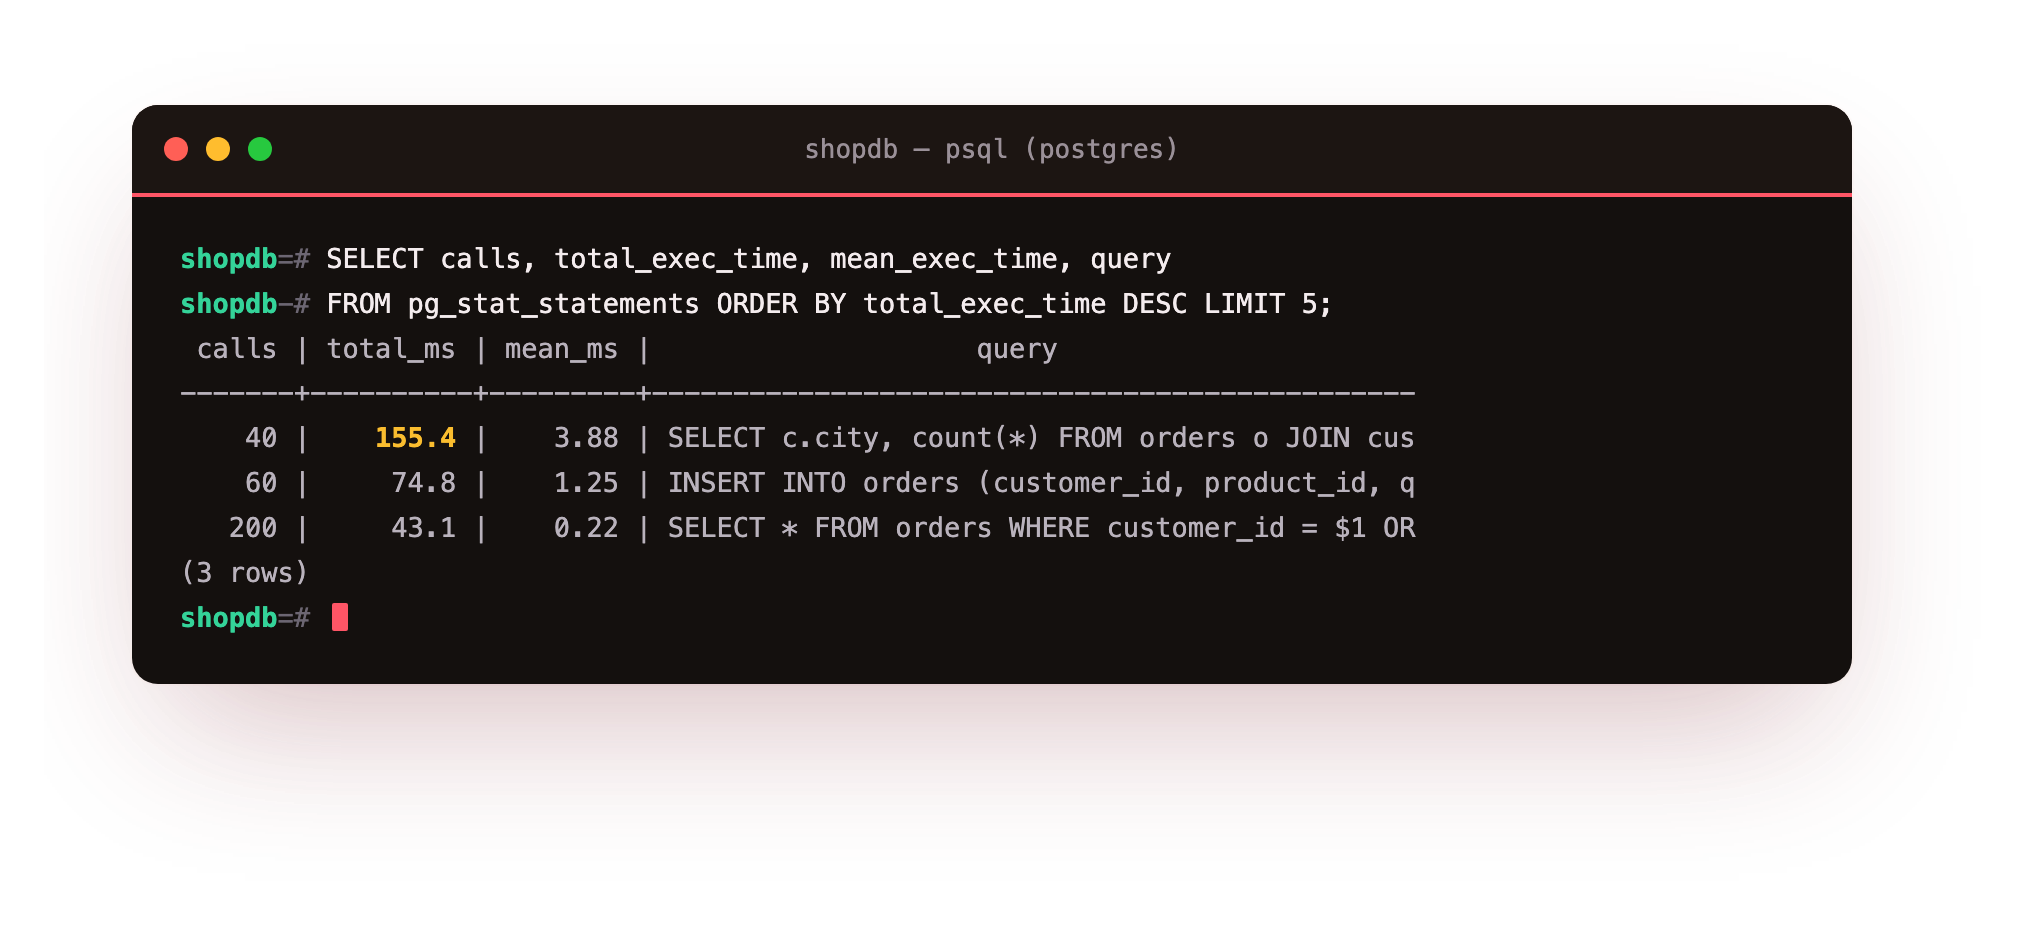
This is the most useful query in this entire guide. It ranks your workload by real cost: total_ms is where your database is actually spending its life, calls shows you whether it is one heavy query or a light one run a million times, and mean_ms separates the two.
Sort by total_exec_time, take the top few, run EXPLAIN (ANALYZE, BUFFERS) on each, and you are now optimizing the queries that matter instead of the ones you happened to notice. This single feedback loop, find the expensive query, explain it, fix it, measure again, is most of what database performance work actually is.
Let autovacuum do its job
One last thing that silently ruins PostgreSQL performance over time: dead rows. Every UPDATE and DELETE leaves behind a dead version of the row, and if they are not cleaned up, your tables bloat, your indexes bloat, and everything slows down. PostgreSQL has a background process, autovacuum, that cleans this up automatically, and the correct action for most people is to leave it on and make sure it is keeping up rather than to turn it off. You can check whether your busy tables are being vacuumed and analyzed:
sudo -u postgres psql -d shopdb -c \
  "SELECT relname, n_dead_tup, last_autovacuum, last_autoanalyze FROM pg_stat_user_tables ORDER BY n_dead_tup DESC;"
If n_dead_tup is high and last_autovacuum is old or empty on a table that changes a lot, autovacuum is falling behind, and the fix is usually to make it run more aggressively on that table, not less. The common mistake is disabling autovacuum because it "uses resources," which trades a small steady cost for a large sudden one when the table finally has to be vacuumed under load.
Troubleshooting tuning and monitoring problems
PostgreSQL will not restart after you raise shared_buffers. The value exceeds what the kernel or the box can give it. Lower it toward 25% of RAM and read the server log for the shared-memory error, which names the limit it hit.
pg_stat_statements returns "relation does not exist" or stays empty. The library was not preloaded. Add pg_stat_statements to shared_preload_libraries, restart, then run CREATE EXTENSION pg_stat_statements.
A query still shows a Seq Scan despite an index. The planner thinks a scan is cheaper, often because effective_cache_size is too low or the WHERE clause cannot use the index. Raise effective_cache_size and confirm the filtered column is actually indexed.
The database is OOM-killed under load after tuning. work_mem times concurrency is too high for the RAM. Lower work_mem and let the connection pool from the previous chapter cap how many queries run at once.
Frequently asked questions
Do I have to restart PostgreSQL for these settings?
shared_buffers and shared_preload_libraries need a restart. work_mem, effective_cache_size, and maintenance_work_mem take effect with a reload, using SELECT pg_reload_conf() or a service reload.
Should I ever turn autovacuum off?
No. Disabling it trades a small steady cost for a large sudden one when the table finally has to be vacuumed under load. If it falls behind, make it run more aggressively on the busy table instead of switching it off.
What does the Buffers line in EXPLAIN tell me?
It counts the blocks the query touched, which is its real cost. When you add an index and the buffer count drops, you have measured proof the index helped rather than a hunch.
Is pg_stat_statements safe to run in production?
Yes. It is a lightweight extension that aggregates query statistics with low overhead, and it is the standard way to find which queries cost the most total time across your workload.
Where PostgreSQL tuning and monitoring leaves you
You have sized PostgreSQL to the server you actually own, so it caches more and spills less, and you have a repeatable way to find and fix the queries that cost the most, backed by numbers instead of hunches. Together with the earlier chapters, that is a database with a bounded blast radius, a backup you have restored, a pooler in front of it, and a tuning-and-measurement loop you can run whenever things feel slow.
That is PostgreSQL in production on a single VPS, done properly, and every piece of it ran on a 2-core, 1.9 GB server, the kind of box most applications actually start on. The next step up, when you outgrow one server, is a replica for read scaling and failover, which needs a second machine. But the four things in this guide are what keep a single-server database healthy long before you need two, and most applications live happily on this setup for a very long time.