What you will have
This tutorial shows you how to speed up WordPress on a VPS with three changes that stack: a tuned PHP OPcache, a Redis object cache, and an nginx FastCGI micro-cache. It is written for a specific person, the one running a real WordPress site on a small slice that feels sluggish under any load, where the dashboard drags and the front page crawls the moment more than one visitor lands at once. You will fix that, and you will measure the fix so you know it is real.
Here is the destination, shown first, with the honest numbers from the site we optimised while writing this. Every figure below was measured on our lab box, a single small slice, not estimated.
# one WordPress front page, before and after, under the same load
ab -n 200 -c 10 https://your-domain/     # requests per second
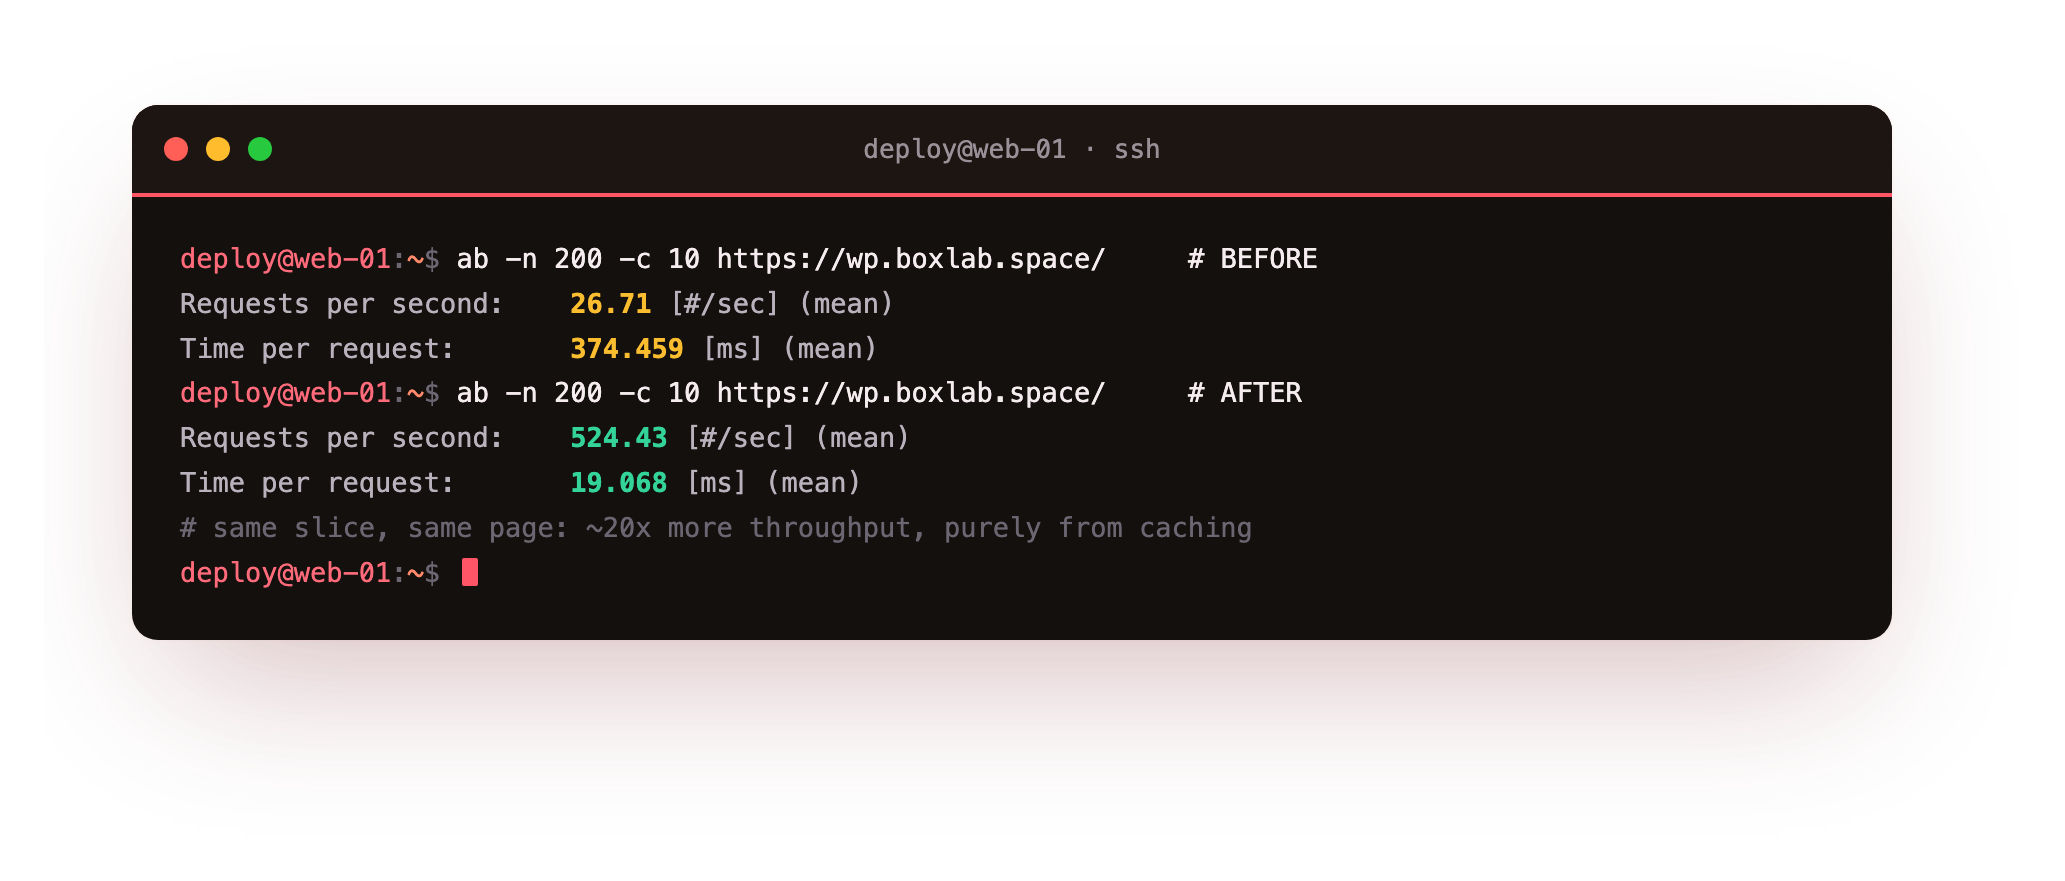
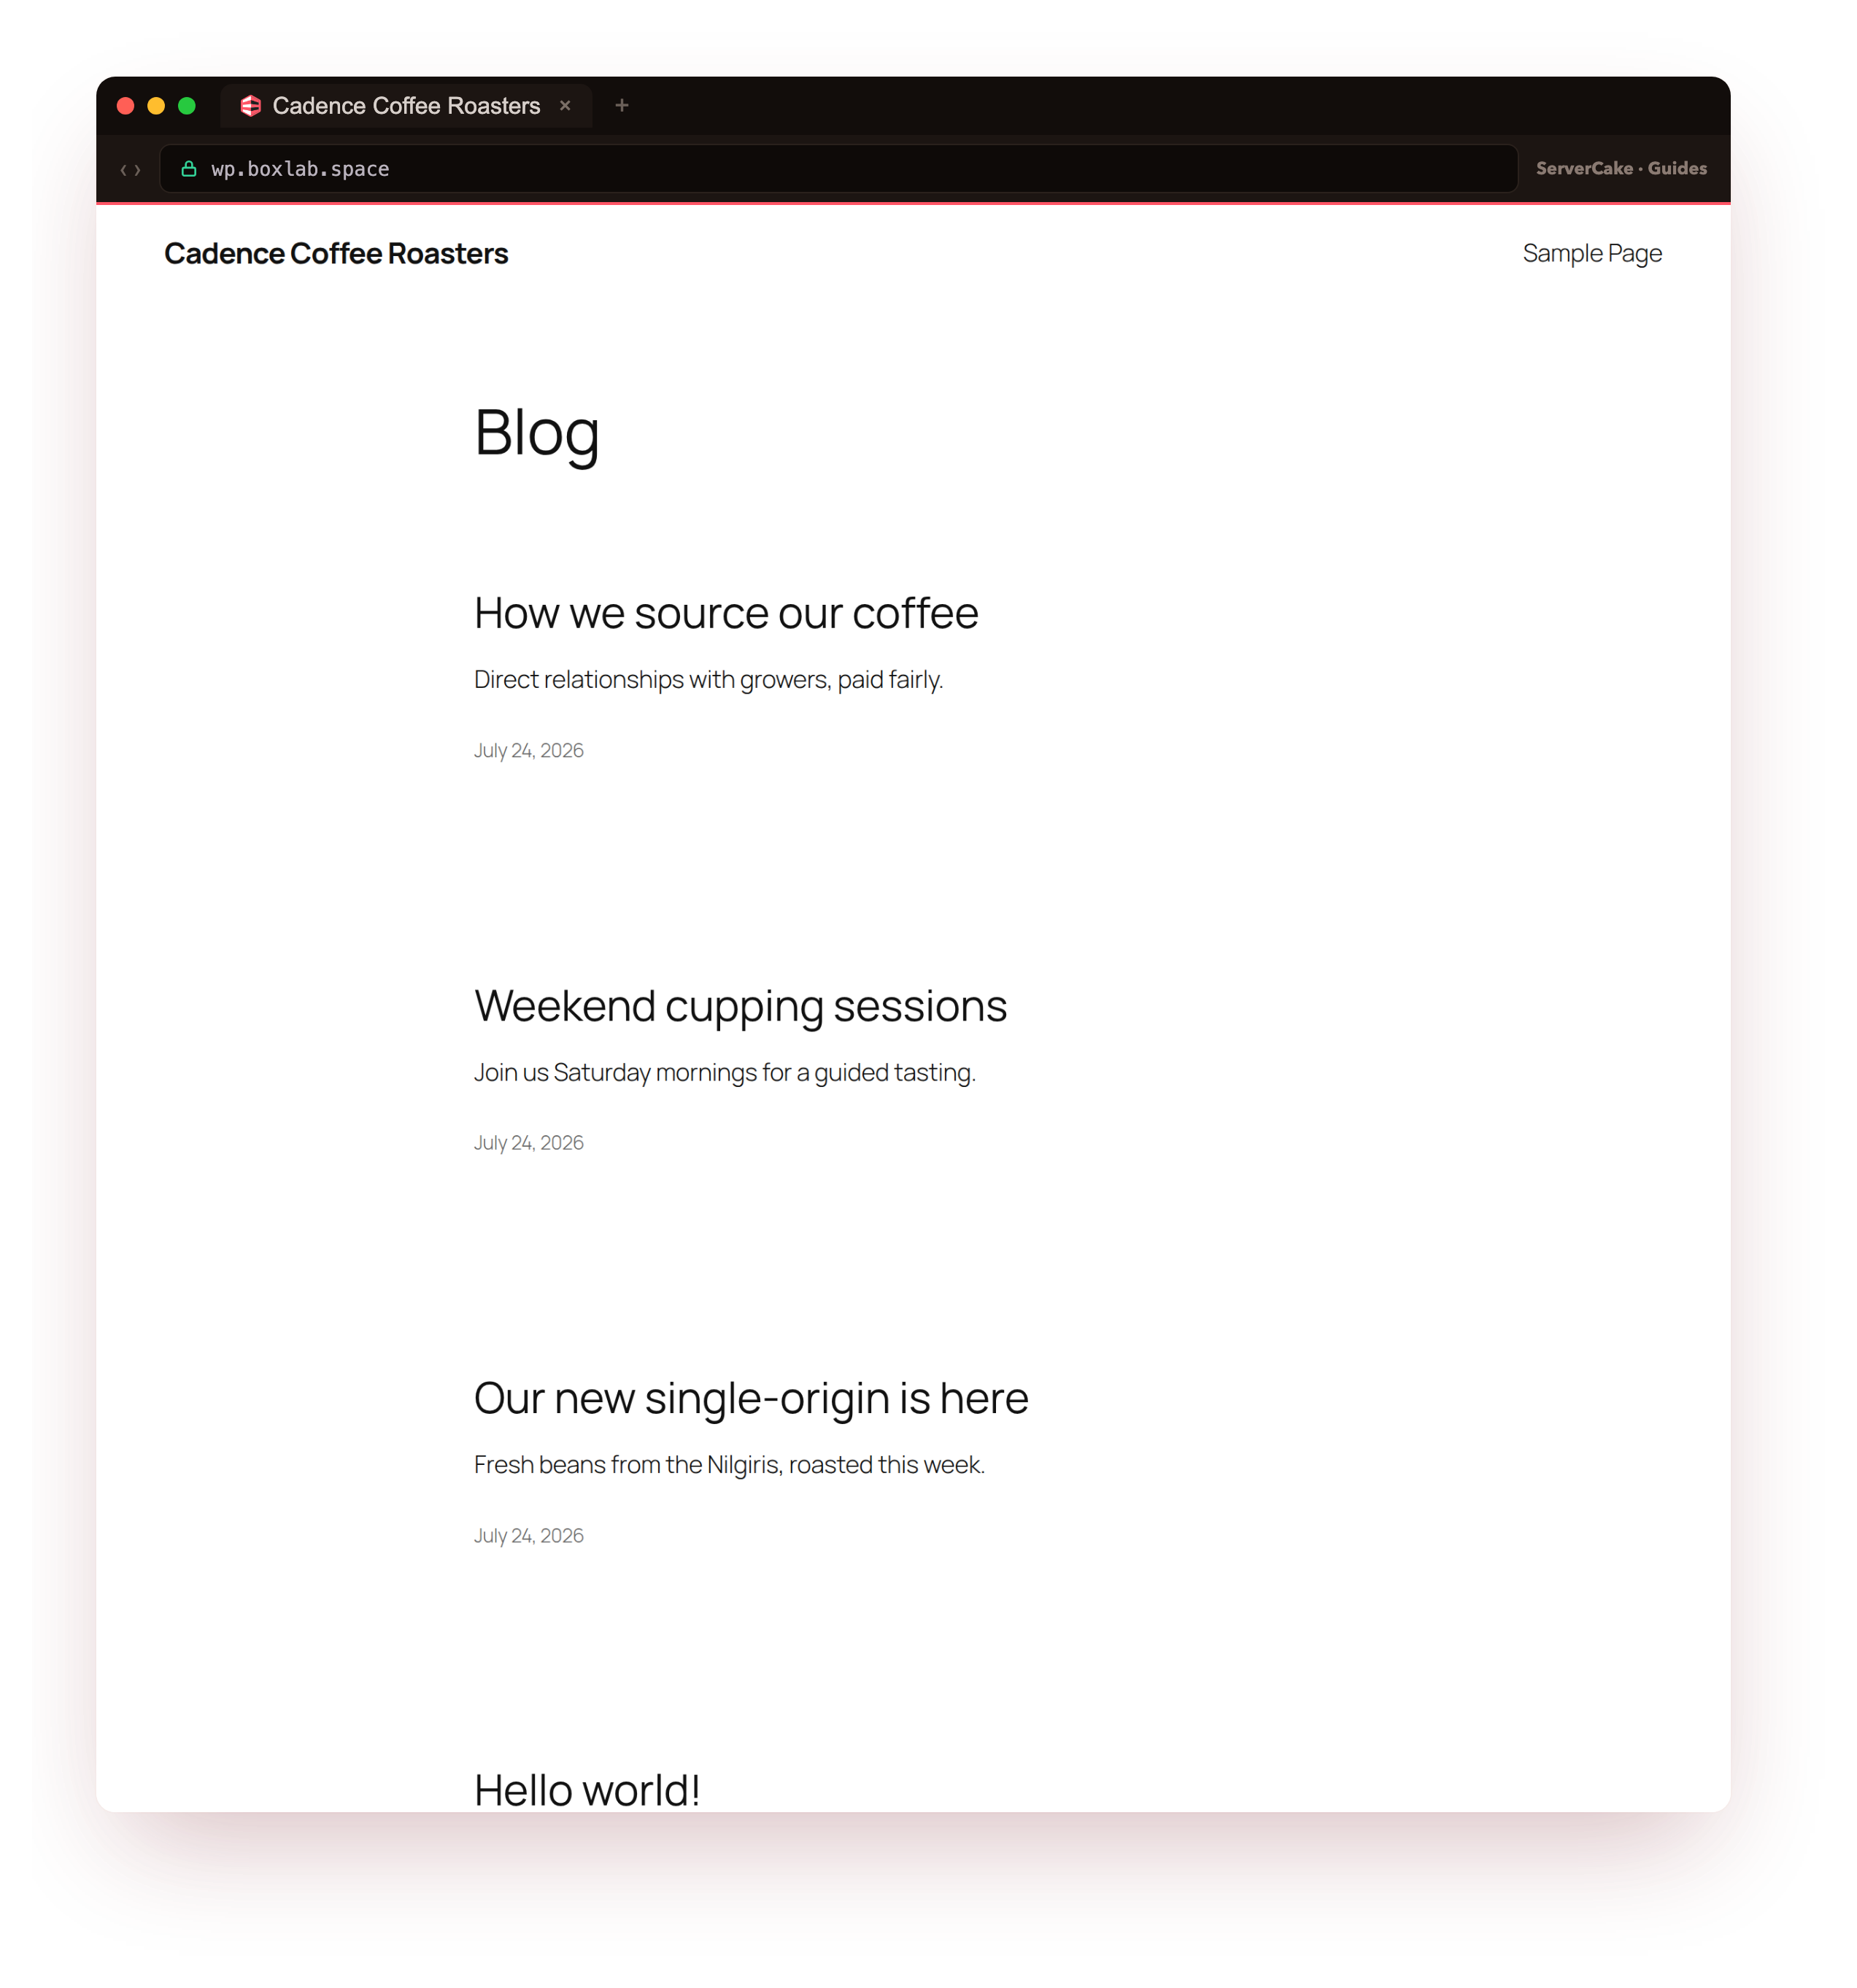
On that box the same front page went from 26.71 requests per second to 524.43, with time-to-first-byte dropping from about 100 milliseconds to about 40, and database queries per page falling from around 26 to 1. That is roughly a twentyfold jump in throughput on identical hardware, and none of it involved a bigger slice. It came from serving the right thing from the right cache.
- Baselining the site with a real load test so the gains are honest, not guessed.
- Tuning the PHP OPcache so WordPress code compiles once and stays compiled.
- Adding a Redis object cache so repeated database lookups come from memory instead.
- Adding an nginx FastCGI micro-cache so anonymous page views skip PHP entirely.
- Measuring again, then keeping the site fast with cache limits and purging.
The idea behind all three layers is the same: do expensive work once, then reuse the result. OPcache reuses compiled PHP, Redis reuses query results, and the micro-cache reuses whole rendered pages. Stacked together on a slice you control, they turn a site that stalls under load into one that shrugs it off.
Before you begin
This tutorial optimises a site that already runs, so it assumes you have one to work on.
- A working WordPress site on a slice, served by nginx and PHP-FPM, following how to install WordPress on a VPS. This tutorial builds directly on that stack (Ubuntu 24.04, nginx, PHP 8.3-FPM, MariaDB).
- SSH access to the slice as a normal user cleared for
sudo, and shell access to WordPress throughwp-cli, which the install tutorial sets up. - About an hour, and a willingness to run a load test before and after so you can see the difference rather than assume it.
Everything below runs as a normal sudo user over SSH on the slice itself. Where a change needs root, it uses sudo, so you never log in as root directly.
How to speed up WordPress on a VPS
The whole job is four steps, and it helps to see them before you start. You will speed up WordPress on a VPS by measuring first, then adding three caches that each reuse a different kind of expensive work:
- Baseline the site with a real load test, so every later number has something to beat.
- Tune the PHP OPcache so compiled code stays resident in memory.
- Add a Redis object cache so repeated database lookups come from memory instead.
- Add an nginx FastCGI micro-cache so anonymous page views skip PHP entirely, then measure again.
Work in that order, because each layer builds on the last, and because measuring at both ends is the only way to know the caching did what you think it did.
Baseline it first
You cannot claim a speedup you did not measure, so measure the slow site before you touch it. Two numbers matter: how many requests per second the front page can serve under light concurrency, and the time-to-first-byte of a single request. The ab tool (Apache Bench, from apache2-utils) gives you the first, and curl gives you the second.
# measure BEFORE you change anything
ab -n 200 -c 10 https://your-domain/
curl -w 'ttfb=%{time_starttransfer}s\n' -o /dev/null -s https://your-domain/
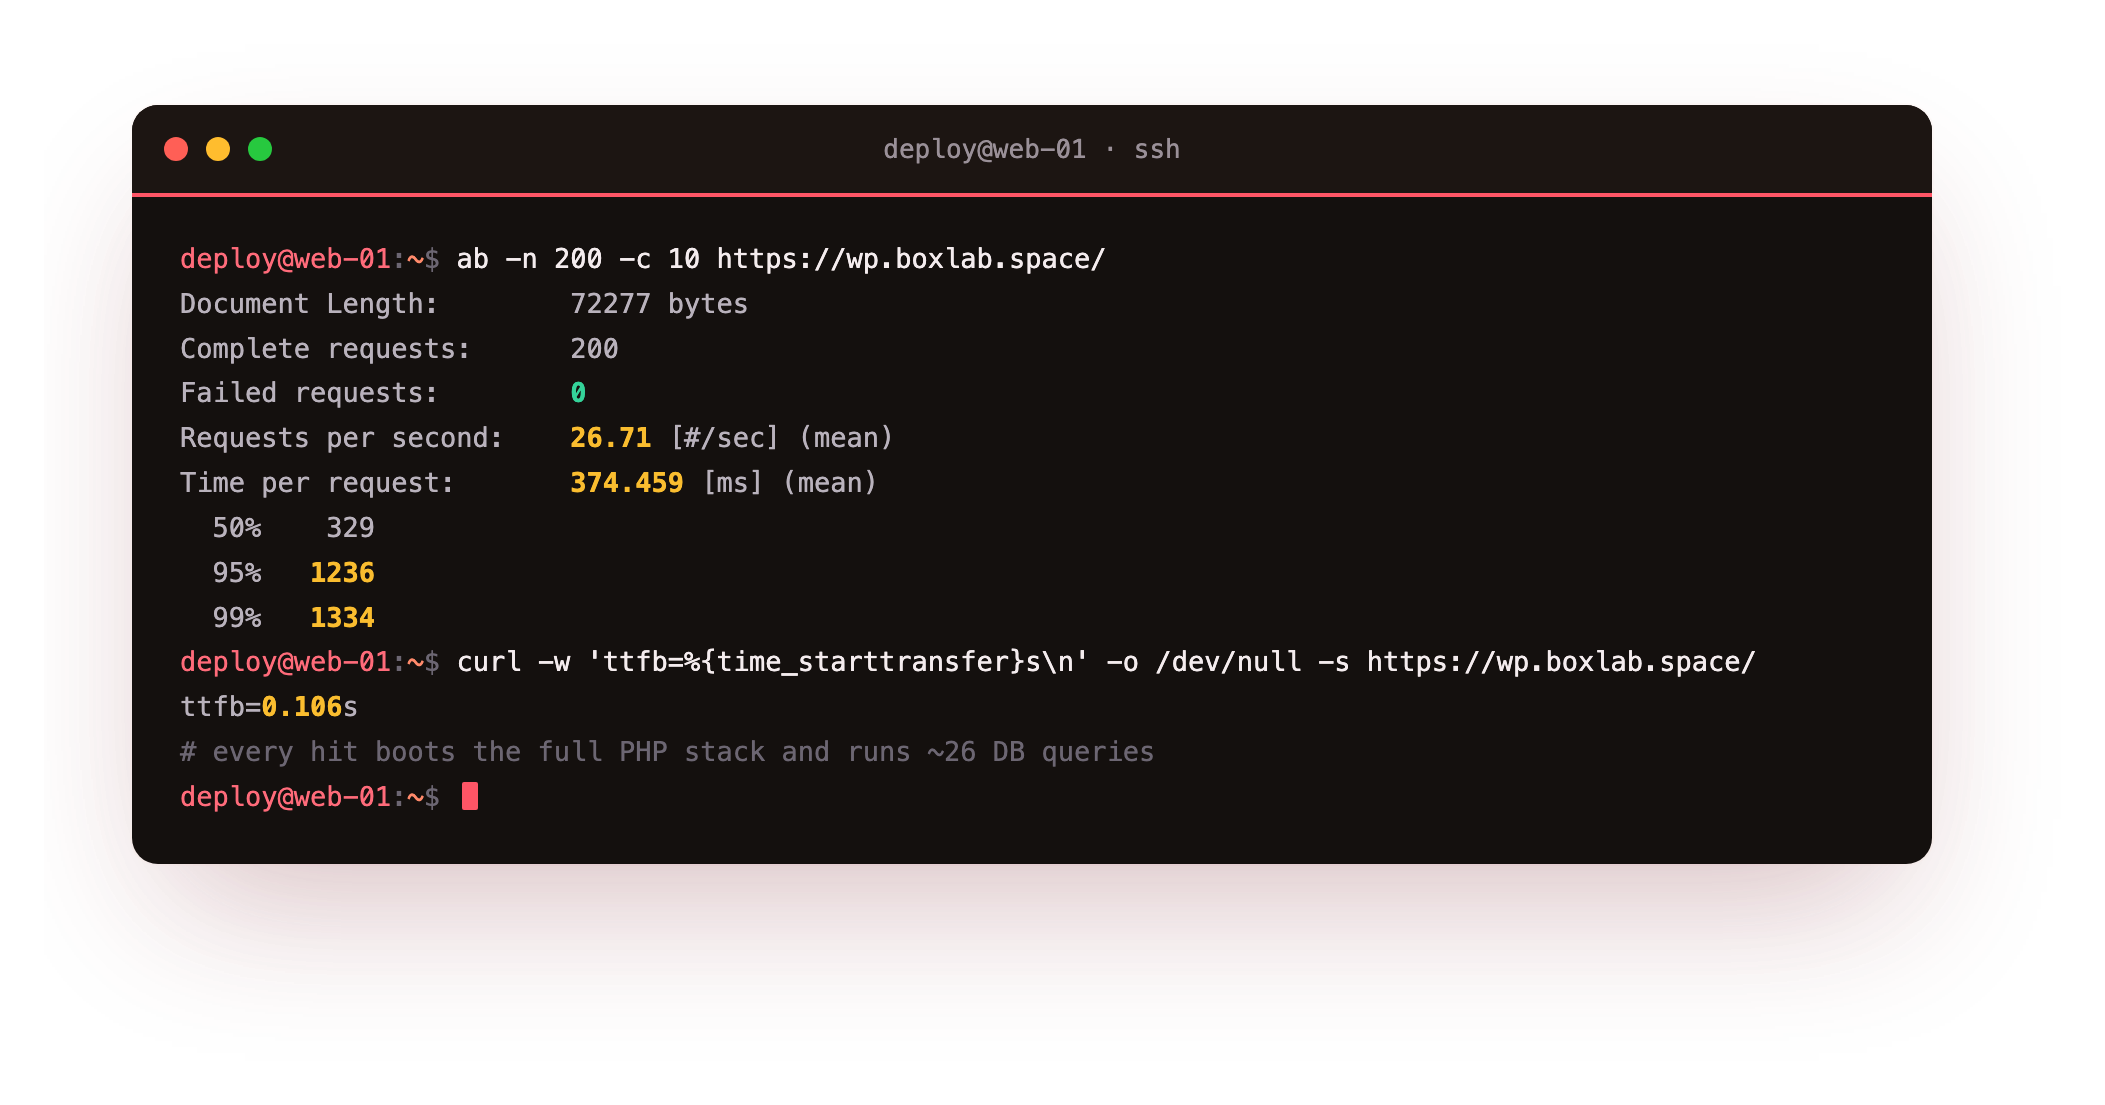
On our lab box, out of the box, that front page managed 26.71 requests per second with a mean of 374 milliseconds each, and 5 percent of requests took over 1.2 seconds under a load of just ten concurrent readers. Every one of those requests booted the full WordPress PHP stack and ran about 26 database queries. That is the starting line, and it is the honest reason the site felt slow.
Tune the PHP OPcache
Every WordPress request executes PHP, and without a cache PHP recompiles that code from source on every single hit. OPcache stores the compiled bytecode in shared memory so the work happens once. On Ubuntu 24.04 it ships enabled, which is why it is easy to assume it is doing its job, but its defaults are sized for a small script, not a plugin-heavy WordPress site. OPcache runs inside PHP-FPM, not the command line, so read its live status through the web server with a one-line status file.
# read OPcache's live status through PHP-FPM, then delete the probe
echo '<?php $s=opcache_get_status(false);$c=opcache_get_configuration()["directives"];
printf("max=%dMB used=%.1fMB cached_scripts=%d max_files=%d hit_rate=%.2f%%\n",
$c["opcache.memory_consumption"]/1048576,$s["memory_usage"]["used_memory"]/1048576,
$s["opcache_statistics"]["num_cached_scripts"],$c["opcache.max_accelerated_files"],
$s["opcache_statistics"]["opcache_hit_rate"]);' | sudo -u www-data tee /var/www/wp/opcache-status.php >/dev/null
curl -s https://your-domain/opcache-status.php
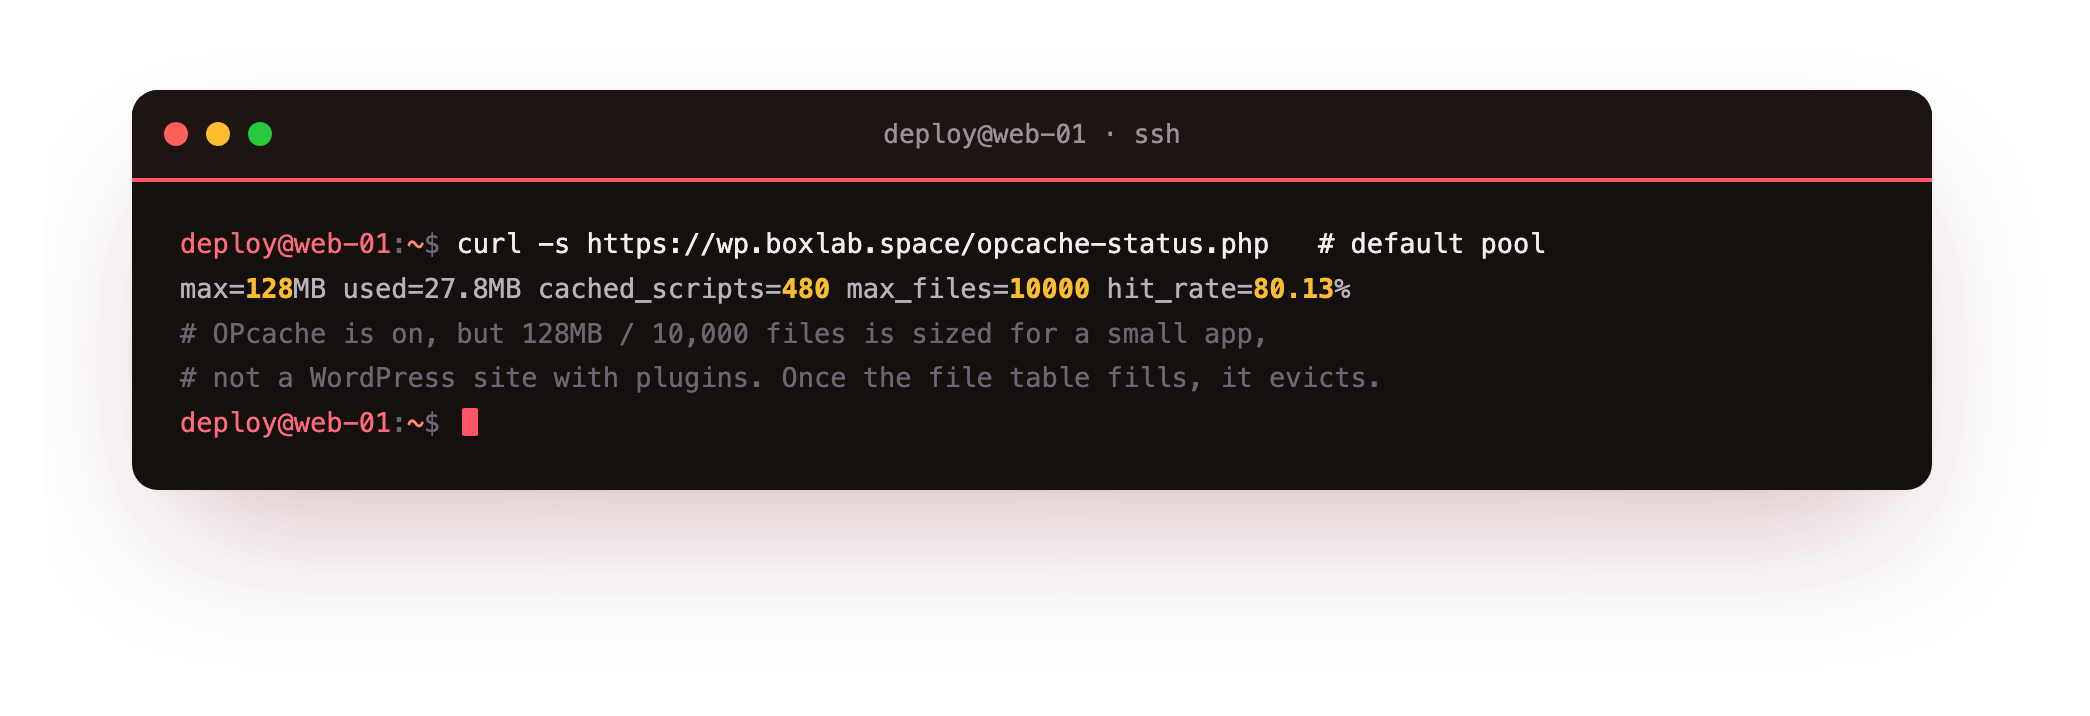
The defaults give OPcache 128 MB of memory and room for 10,000 files. A stock WordPress plus a handful of plugins can push past 10,000 files, and once the file table fills, OPcache starts evicting and recompiling, which is the slow path you were trying to avoid. Raise both ceilings in a small config file so nothing gets evicted.
; /etc/php/8.3/fpm/conf.d/99-opcache.ini
opcache.enable=1
opcache.memory_consumption=192
opcache.interned_strings_buffer=16
opcache.max_accelerated_files=20000
opcache.validate_timestamps=1
opcache.revalidate_freq=60
opcache.save_comments=1
Then restart PHP-FPM and let it warm up by loading a few pages. revalidate_freq=60 tells OPcache to check for changed files only once a minute rather than on every request, which cuts filesystem work on a busy site while still picking up your edits within a minute. Keep save_comments=1, because some WordPress plugins read docblock annotations and break without it.
# after the restart, re-check the tuned pool, warmed up, then remove the probe
sudo systemctl restart php8.3-fpm
curl -s https://your-domain/opcache-status.php
sudo rm /var/www/wp/opcache-status.php
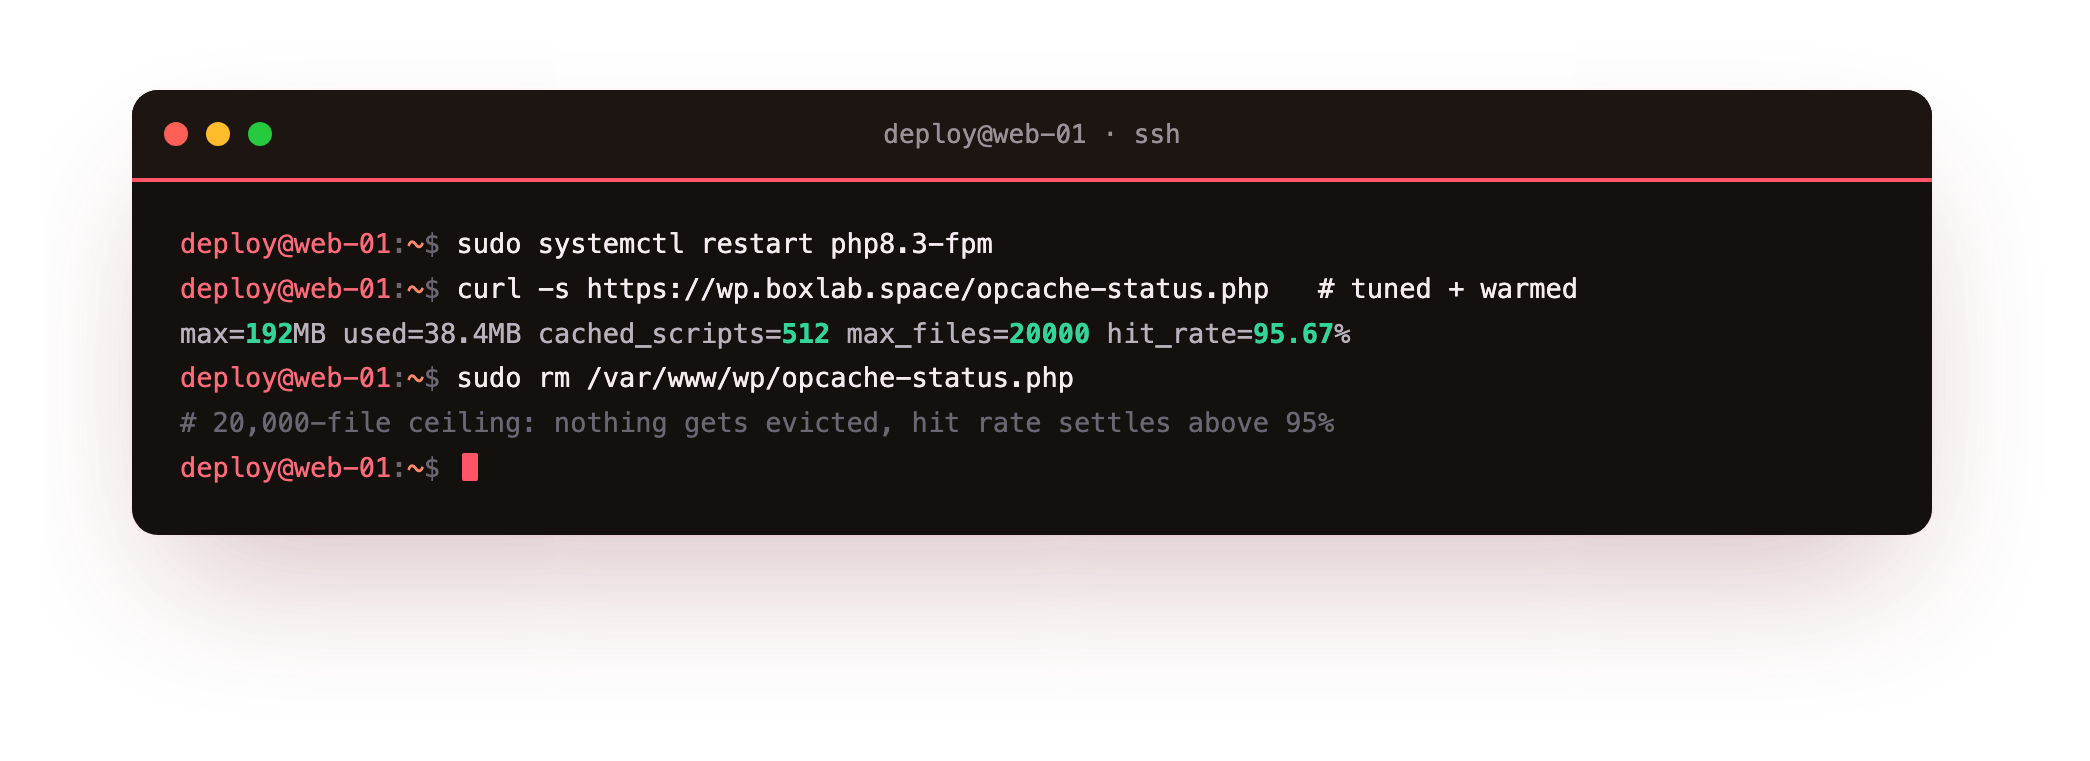
After the restart and a little traffic, OPcache on our box held 512 cached scripts in 38 MB with a hit rate of 95.7 percent, up from a cold 80 percent on the default 128 MB pool. That hit rate is the number to watch: as the cache warms, it should settle well above 95 percent, and if it does not, the memory or file ceiling is still too low.
Add a Redis object cache
OPcache handles code, but WordPress also asks the database the same questions over and over: options, post metadata, term relationships, user data. By default that all goes to MariaDB on every request. A persistent object cache keeps those answers in memory instead, and Redis is the standard store for it. Install Redis first.
sudo apt install -y redis-server
sudo systemctl enable --now redis-server
redis-cli ping
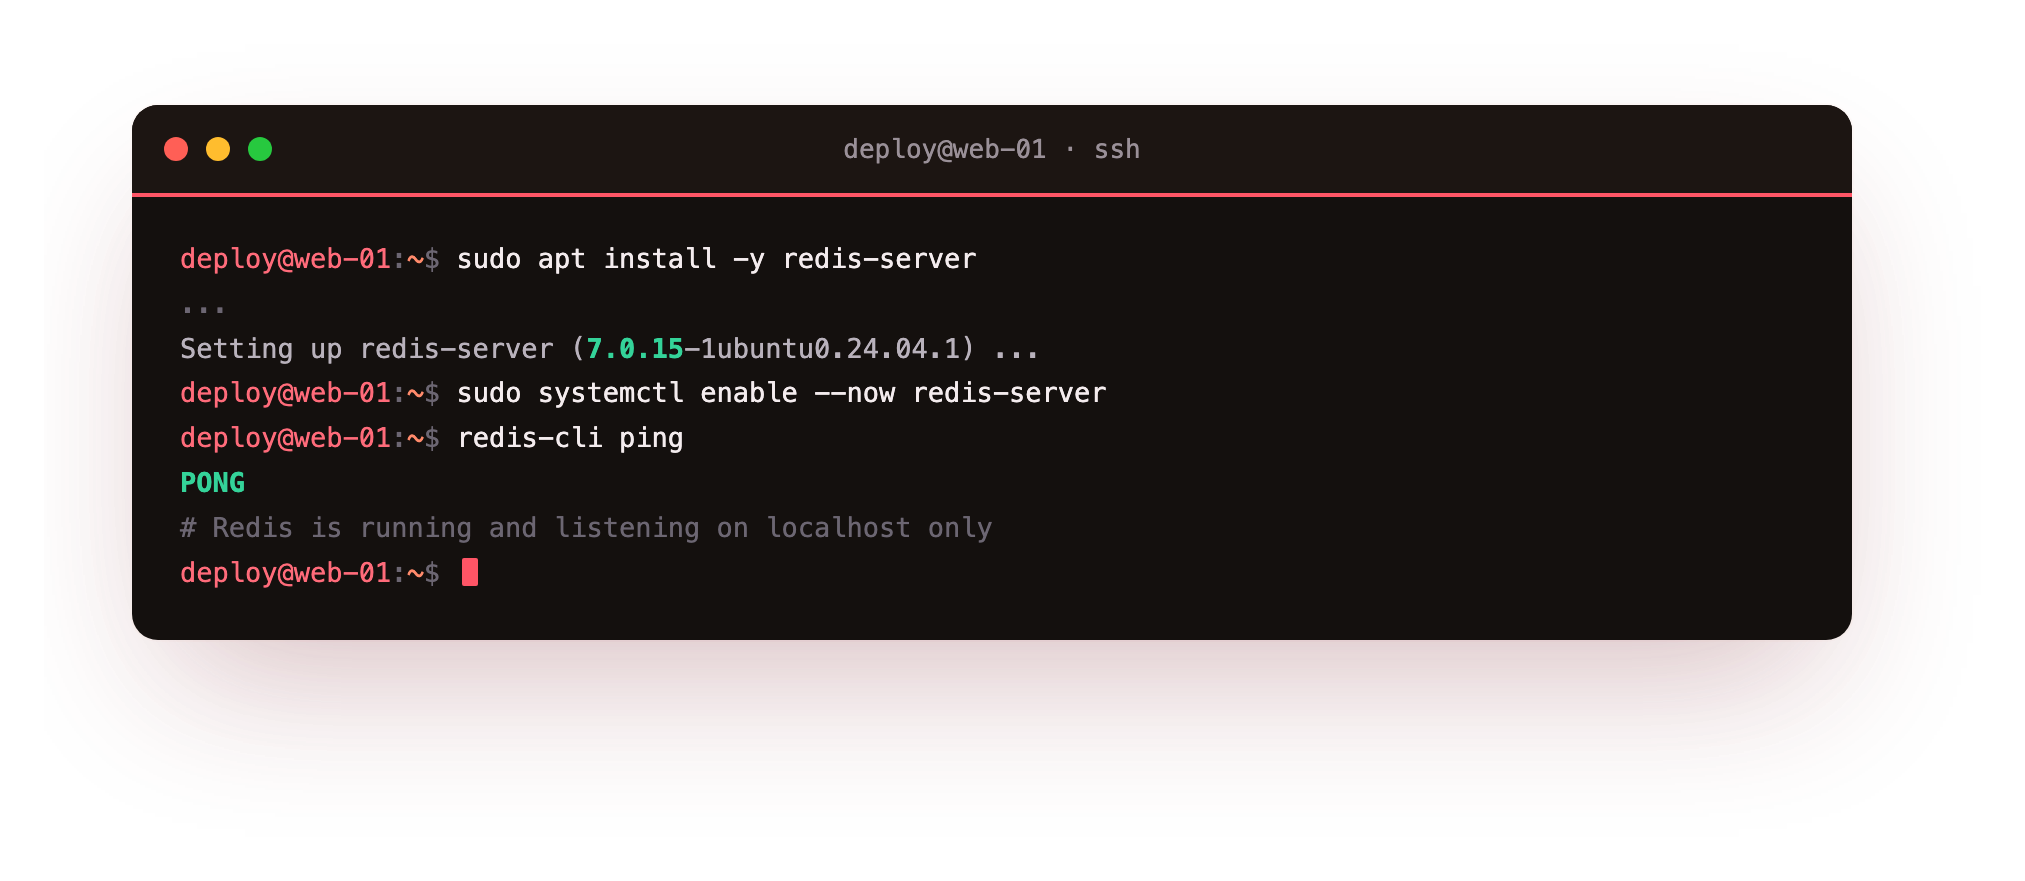
A PONG back means Redis is running and listening on localhost. Now connect WordPress to it. The Redis Object Cache plugin by Till Krüss ships a drop-in that WordPress loads before anything else, so cached objects come from Redis transparently. Install and enable it with wp-cli.
cd /var/www/wp
sudo -u www-data wp plugin install redis-cache --activate
sudo -u www-data wp redis enable
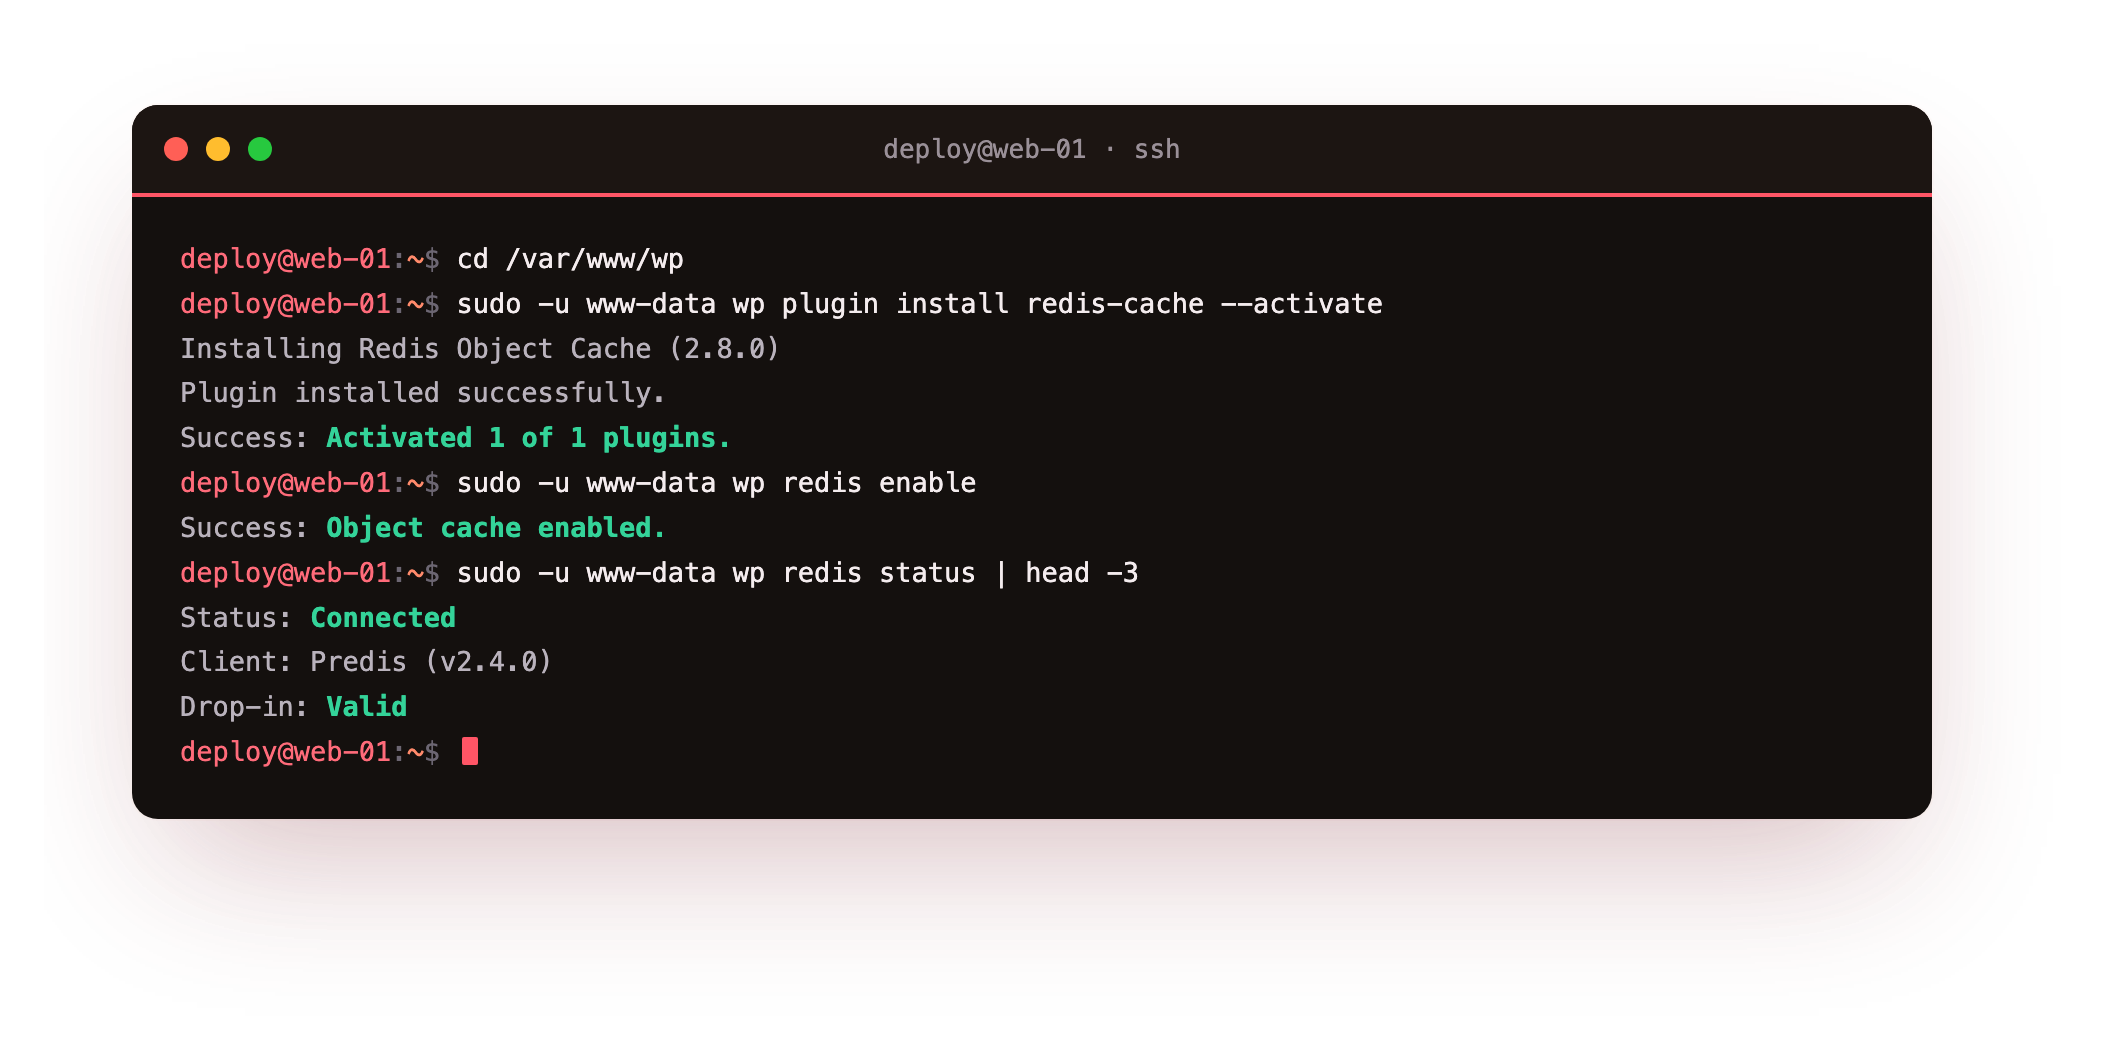
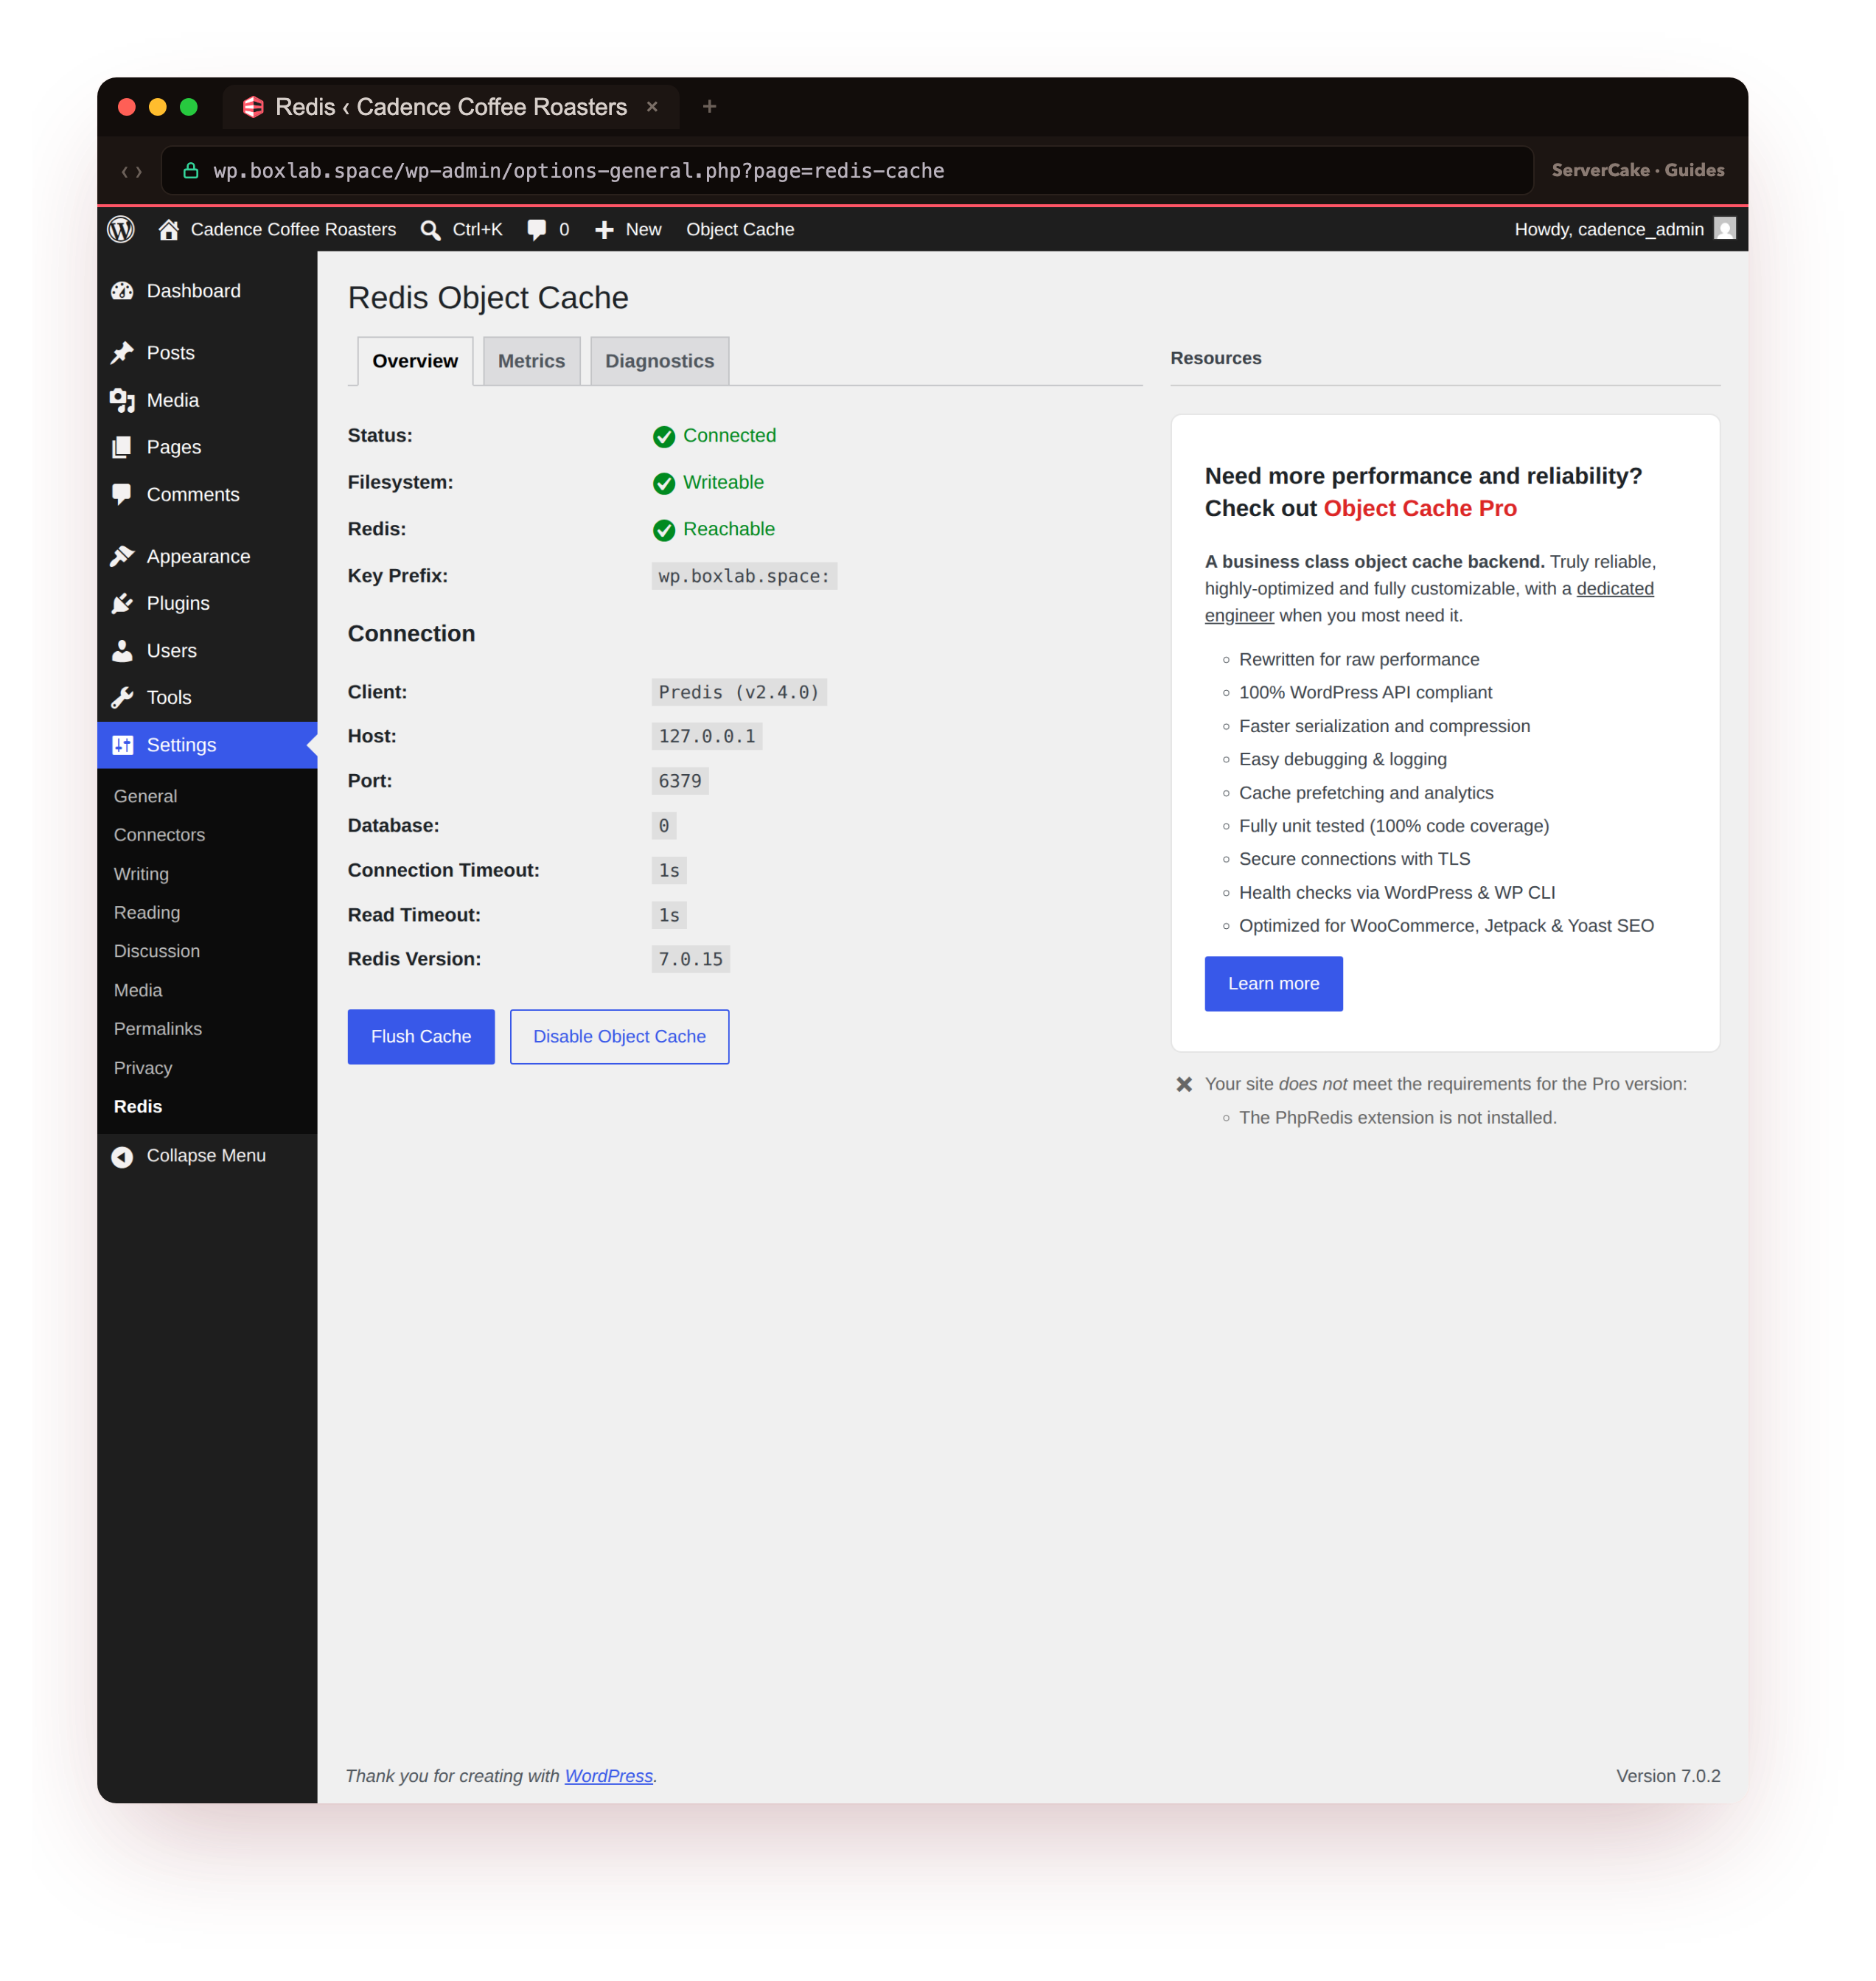
wp redis enable writes the object-cache.php drop-in into wp-content, and wp redis status should now report the connection as valid. Verify it is genuinely serving hits rather than just being installed, because a drop-in that fails silently falls back to the database without telling you.
# prove the cache is doing real work
sudo -u www-data wp redis status
redis-cli info stats | grep keyspace_hits
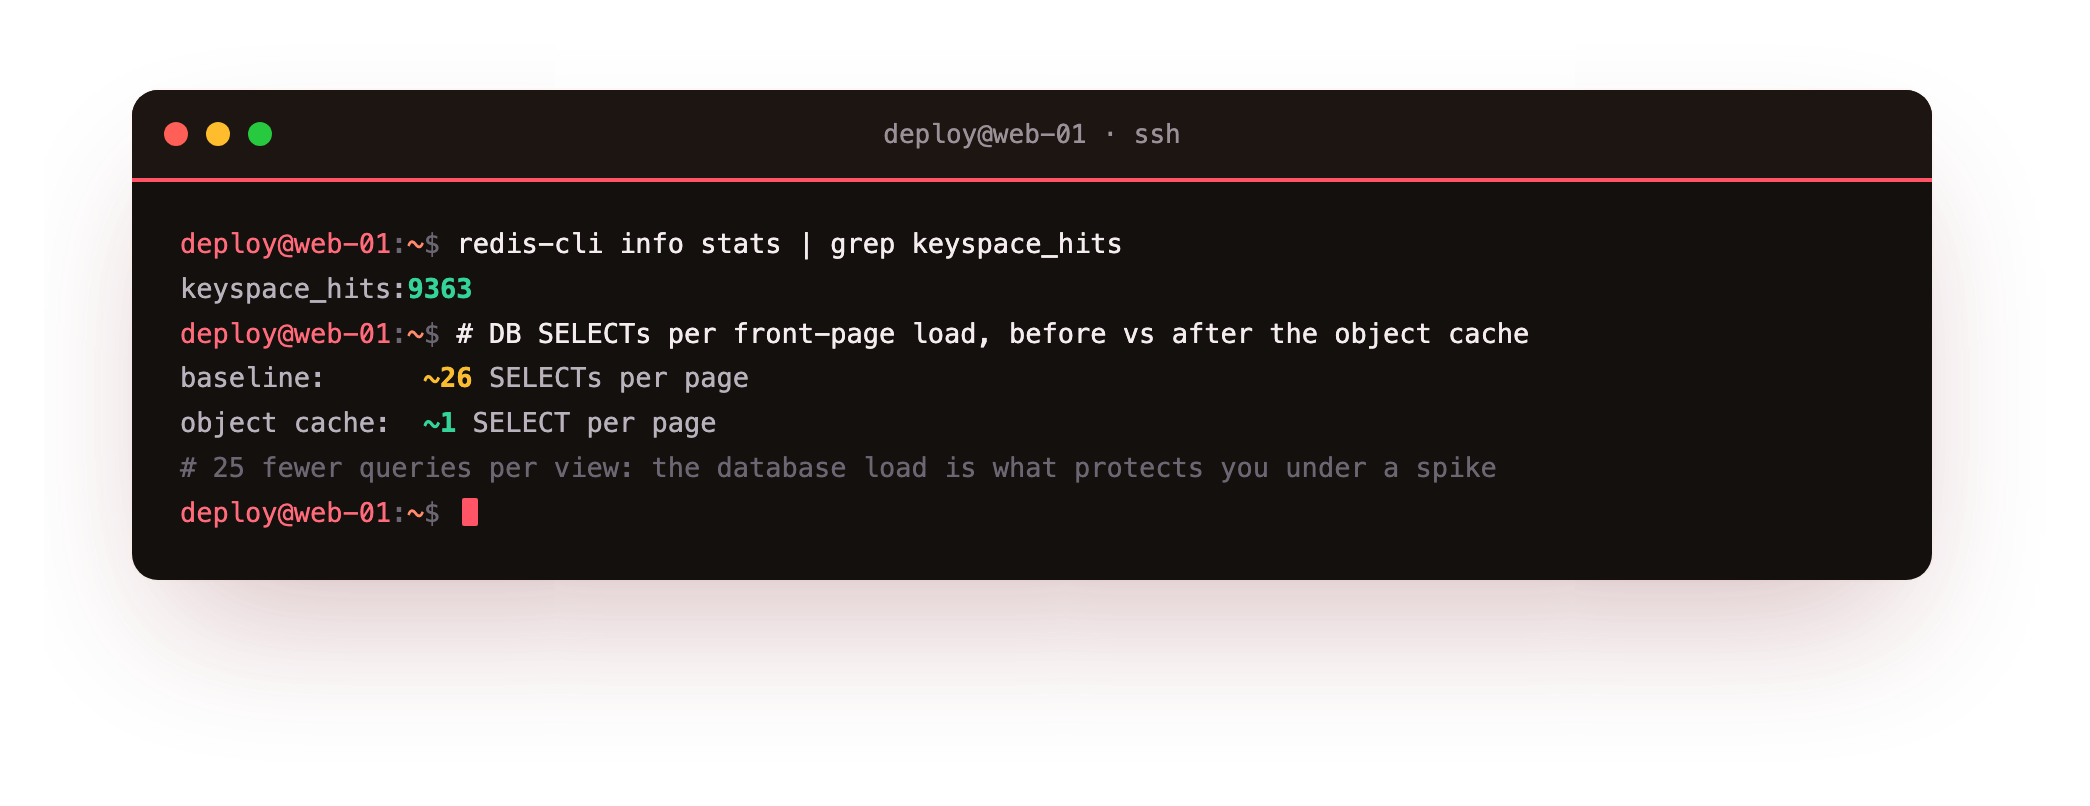
The payoff shows up in the database load. Before the object cache, our front page ran about 26 SELECT statements per view. With Redis warm, that dropped to 1.
Those 25 saved queries per page do not change the time-to-first-byte much when the database is local and idle, because a local query is cheap. They matter enormously under concurrency, though: the database is usually the first thing to fall over when traffic spikes, and cutting its query load by that much is what keeps the whole site standing when it counts.
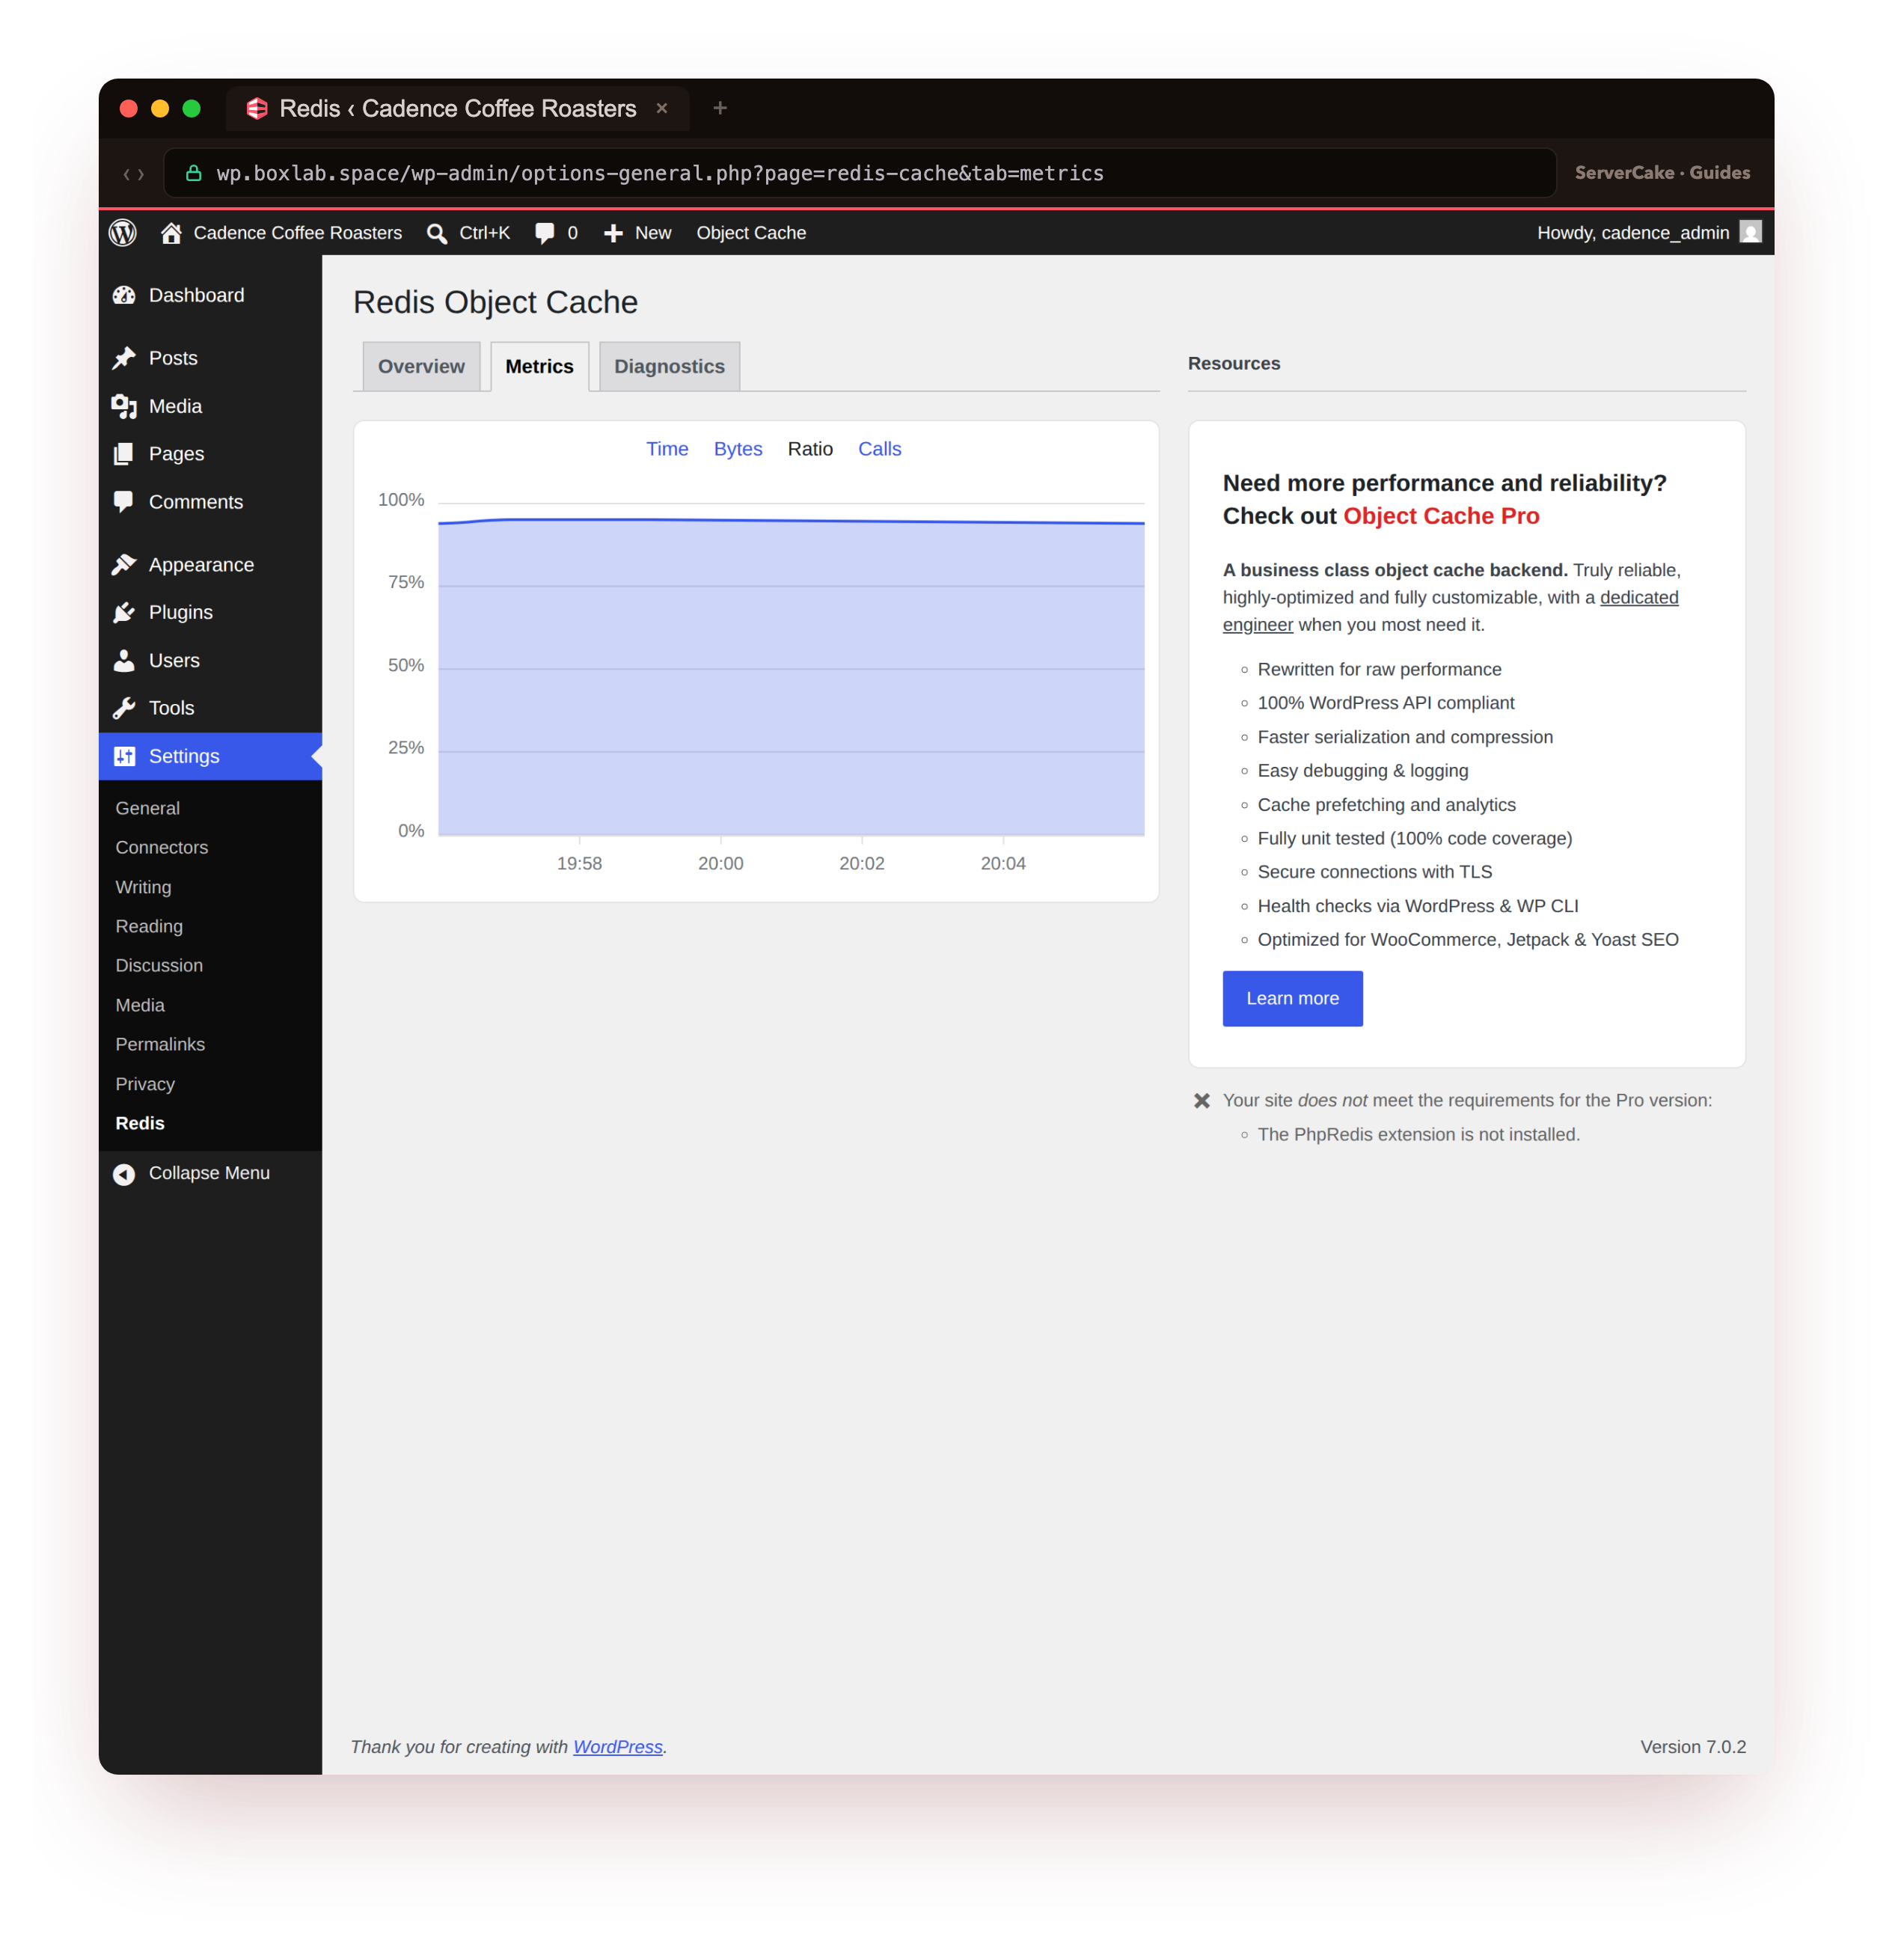
keyspace_hits count in redis-cli confirms real reads are being served from memory.Add an nginx FastCGI micro-cache
OPcache and Redis speed up the work PHP does. The nginx FastCGI micro-cache lets nginx skip PHP altogether for anonymous visitors, serving a whole rendered page straight from a short-lived cache. This is the change that produces the large throughput jump, because a cached page is served at the speed of a static file. First declare a cache zone in the nginx http context.
# /etc/nginx/conf.d/fastcgi-cache.conf
fastcgi_cache_path /var/cache/nginx/fastcgi levels=1:2
    keys_zone=WORDPRESS:10m max_size=200m inactive=60m use_temp_path=off;
fastcgi_cache_key "$scheme$request_method$host$request_uri";
Then wire it into the site's server block. The critical part is the skip rules: you must never serve a cached page to a logged-in user, to a POST request, or anywhere in wp-admin, or someone will see another person's session or a stale cart. Set a $skip_cache flag on those conditions and pass it to the cache directives.
set $skip_cache 0;
if ($request_method = POST)                 { set $skip_cache 1; }
if ($query_string != "")                    { set $skip_cache 1; }
if ($request_uri ~* "/wp-admin/|/wp-json/|wp-.*\.php|/feed/|sitemap") { set $skip_cache 1; }
if ($http_cookie ~* "wordpress_logged_in|wp-postpass|comment_author") { set $skip_cache 1; }

location ~ \.php$ {
    include snippets/fastcgi-php.conf;
    fastcgi_pass unix:/run/php/php8.3-fpm.sock;
    fastcgi_cache WORDPRESS;
    fastcgi_cache_valid 200 301 302 60m;
    fastcgi_cache_bypass $skip_cache;
    fastcgi_no_cache $skip_cache;
}
Add one header so you can watch the cache work, add_header X-Cache $upstream_cache_status always; at the server level, then test and reload. The first request to a page is a MISS that populates the cache, and every request after it is a HIT served without touching PHP or the database.
sudo nginx -t && sudo systemctl reload nginx
# a cold MISS, then a warm HIT, and wp-admin never cached
curl -sI https://your-domain/ | grep -i x-cache
curl -sI https://your-domain/ | grep -i x-cache
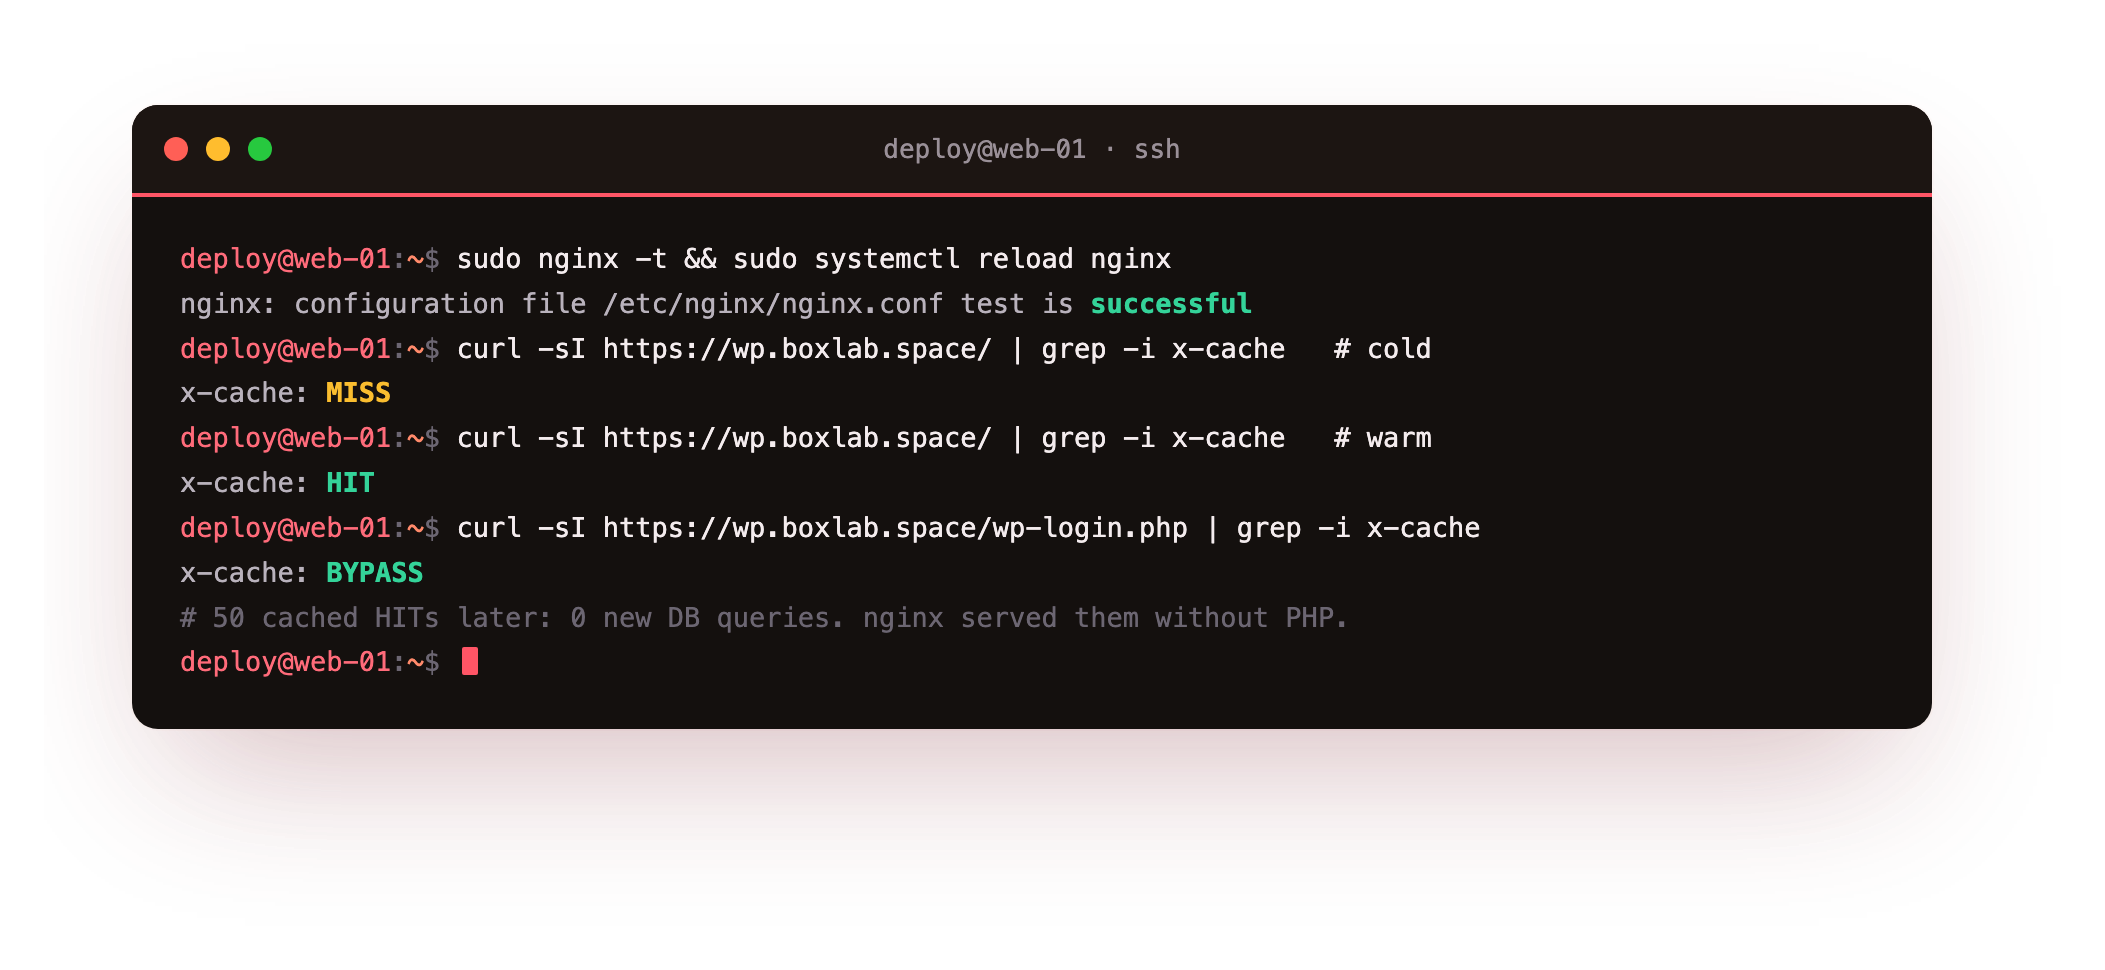
On our box the first response read X-Cache: MISS, the second X-Cache: HIT, and wp-login.php read X-Cache: BYPASS, exactly as the skip rules intend. To confirm PHP and the database really are untouched on a hit, we hammered 50 cached requests and watched MariaDB: zero new queries. The page was served entirely by nginx.
wp-login.php and a logged-in dashboard both return BYPASS before you consider this done.Measure after
Now run the exact baseline command again, on the same slice, and read the payoff.
# measure AFTER: the same load test, now served from the micro-cache
ab -n 200 -c 10 https://your-domain/
curl -w 'ttfb=%{time_starttransfer}s\n' -o /dev/null -s https://your-domain/
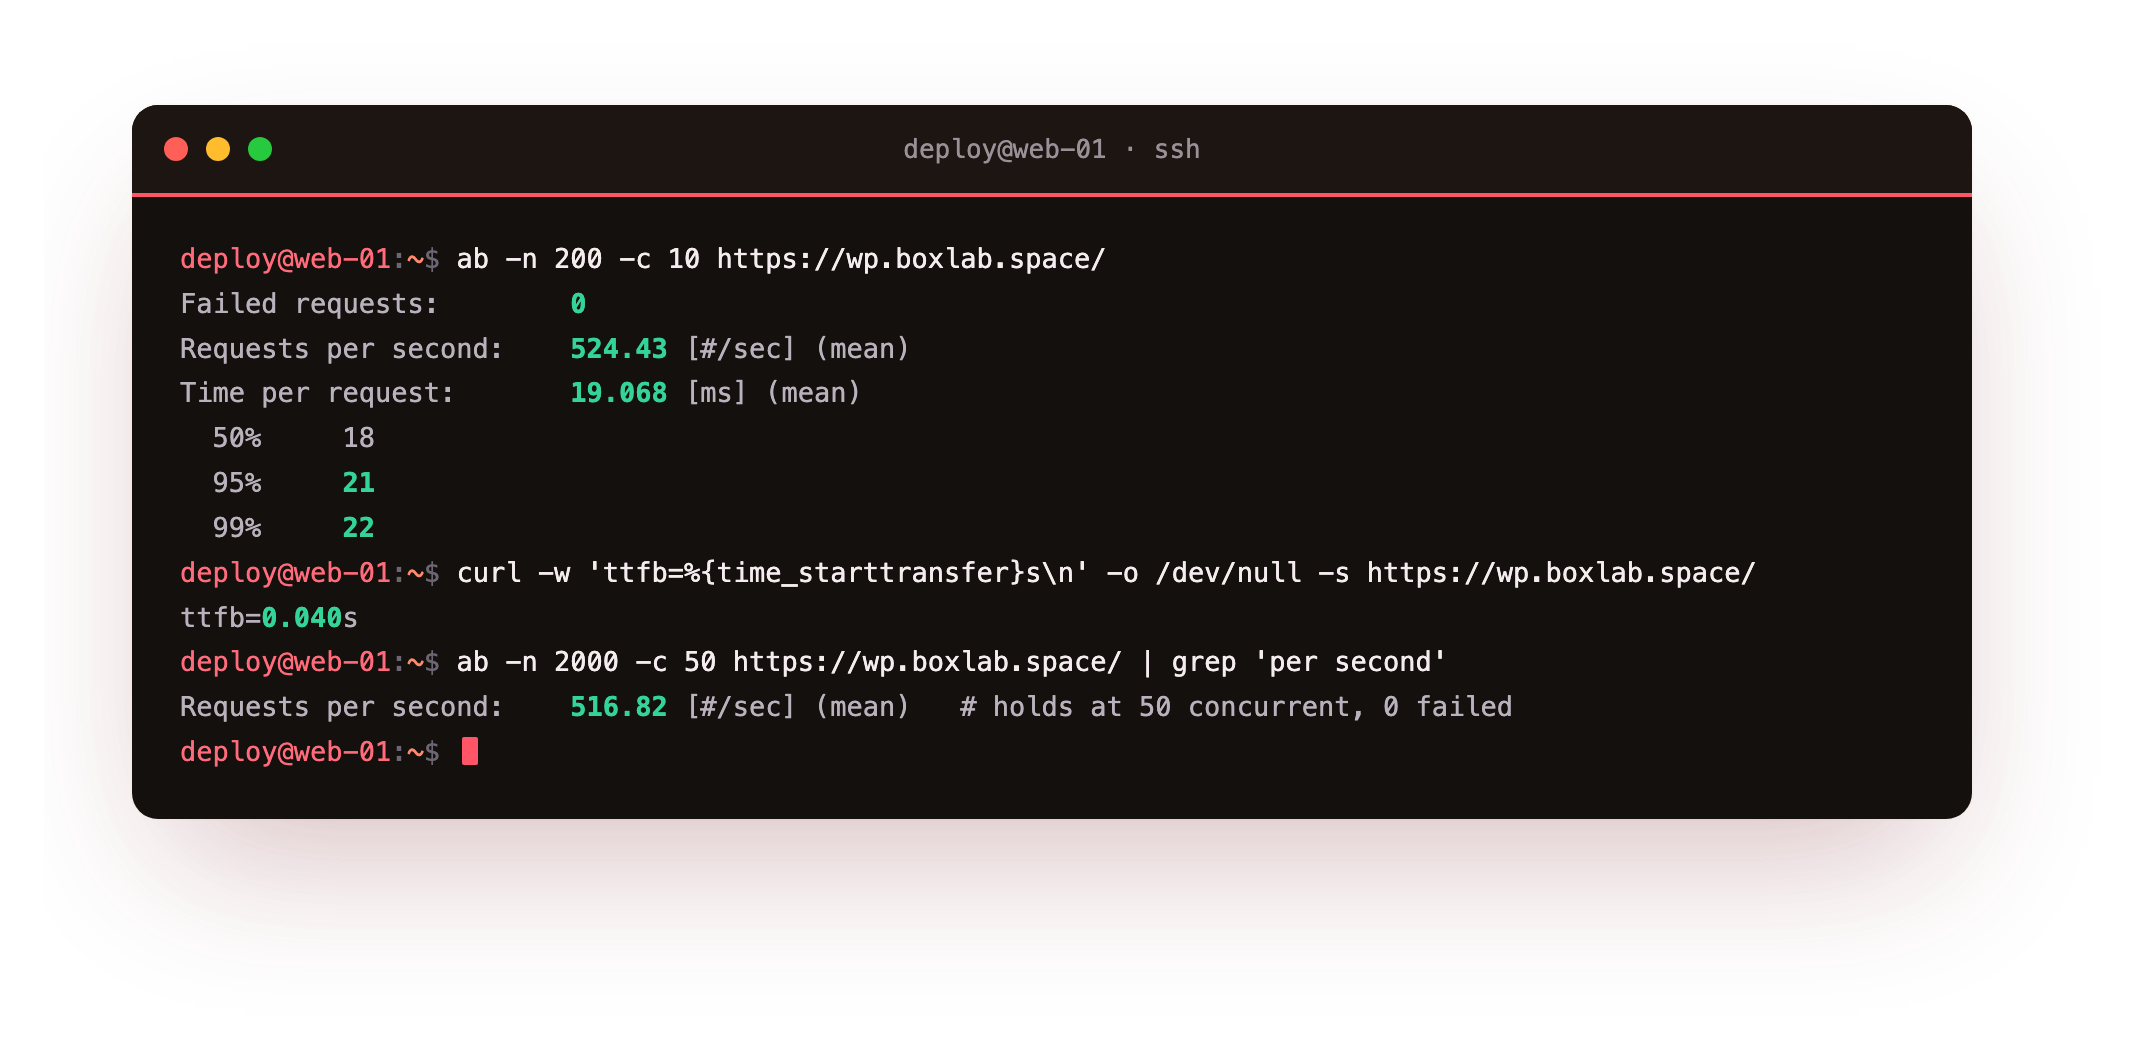
The front page that managed 26.71 requests per second at baseline served 524.43 after, with the mean response time falling from 374 milliseconds to 19, and the 95th percentile from over 1,200 milliseconds to 21. Time-to-first-byte dropped from about 100 milliseconds to about 40. Pushed harder, at 50 concurrent requests, the site held 516 requests per second with zero failures, where the baseline would have buckled. Those are real numbers from a small slice, and they are the honest reason the three caches are worth the hour.
Be clear-eyed about what moved and why. The micro-cache produced almost all of the throughput gain, because it serves anonymous traffic without PHP. OPcache and Redis matter most for the requests that cannot be page-cached: logged-in admins, the checkout, the parts of the site that must run PHP every time. All three earn their place, but they earn it in different places.
Keep it fast
A cache you never watch becomes a cache that lies to you, so give the setup the habits that keep it honest. Two are worth doing now. First, cap Redis memory so it can never grow unbounded and starve the rest of the slice: set maxmemory 256mb and maxmemory-policy allkeys-lru in /etc/redis/redis.conf, which tells Redis to evict the least-recently-used keys instead of failing when it fills. Second, keep an eye on the hit ratio and the cache size.
# watch the caches do their job
du -sh /var/cache/nginx/fastcgi
redis-cli config get maxmemory-policy
redis-cli info stats | grep -E 'keyspace_hits|keyspace_misses'
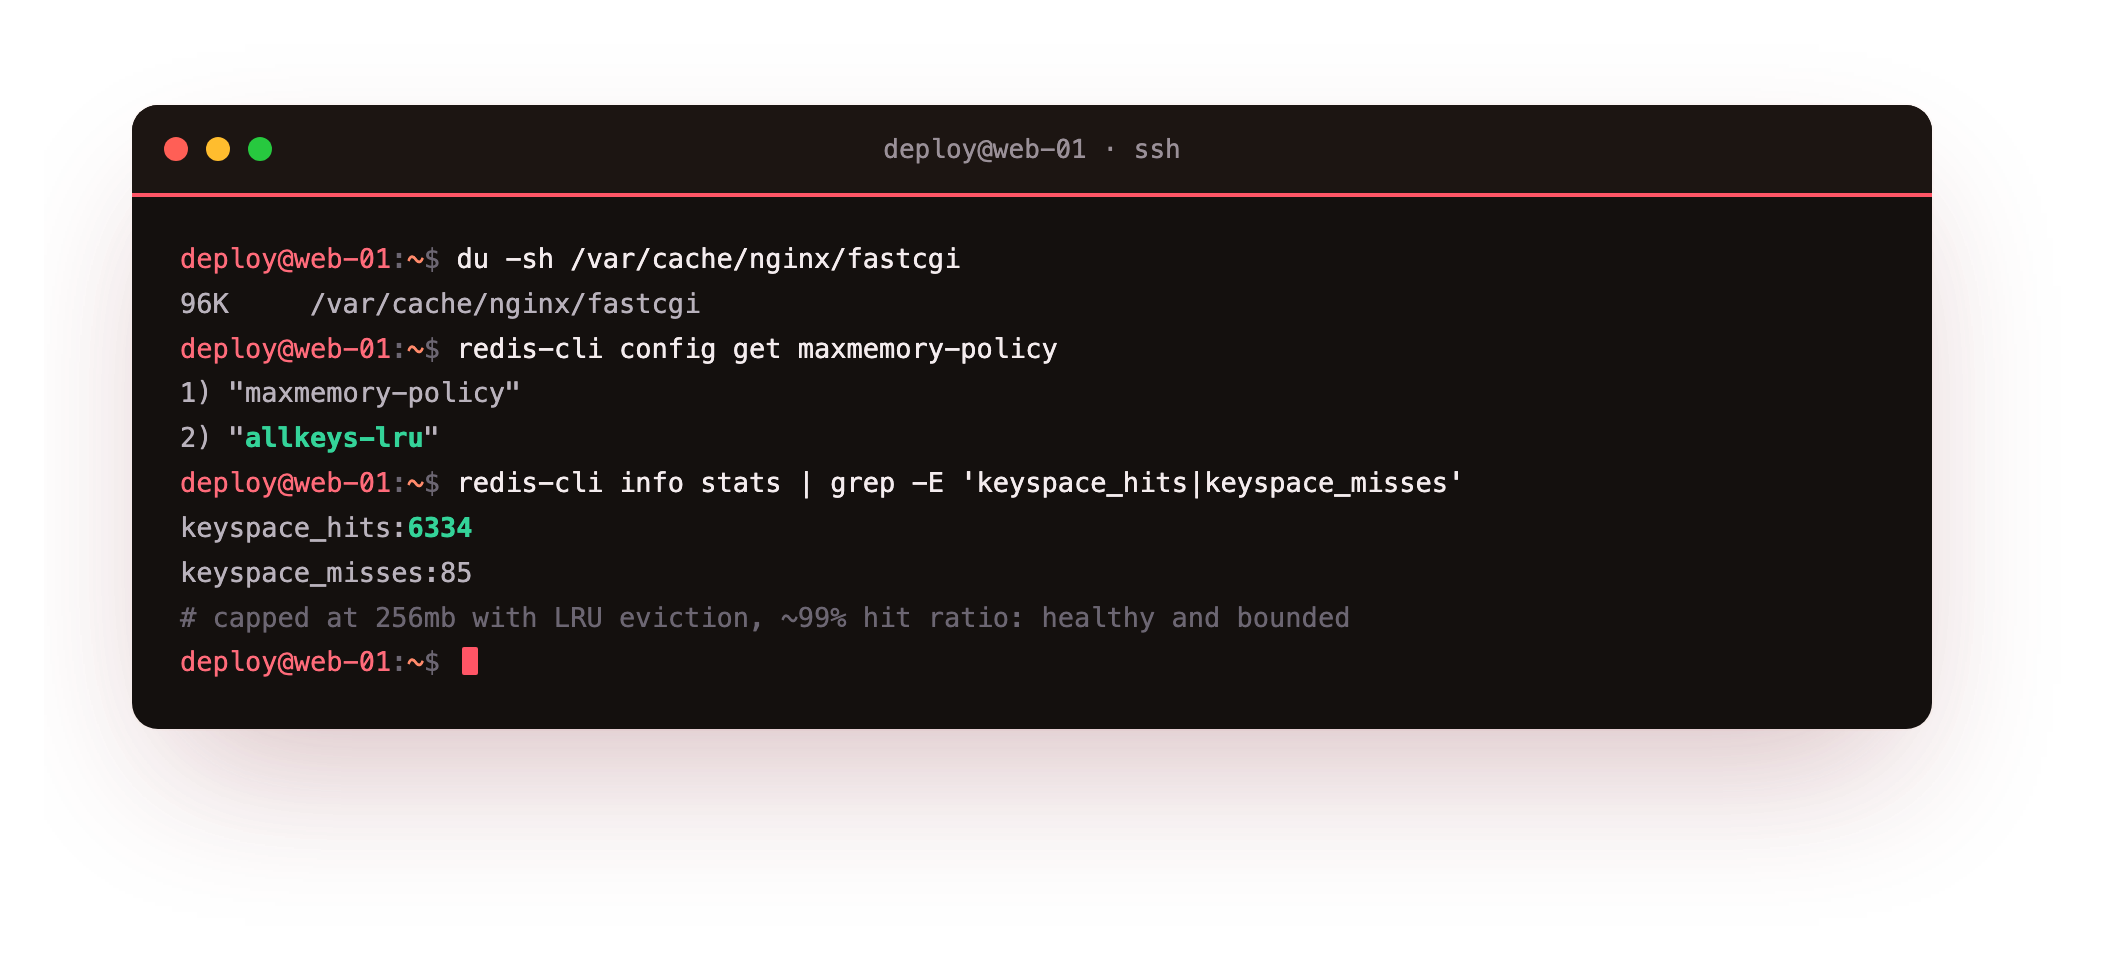
The one thing to plan for is freshness. A 60-minute micro-cache means a new post can take up to an hour to appear to logged-out visitors, which is why the config above uses a short window rather than a day. For instant updates, add the Nginx Helper plugin, which purges the relevant cached pages the moment you publish or edit, so readers see changes at once while everyone else still gets cache-speed pages. Between the self-expiring window and purge-on-publish, you rarely serve anything truly stale.
Finally, know when caching is not the answer. If your logged-in admin is slow, or the checkout drags, page caching cannot help those because they must bypass the cache by design. When the uncached, dynamic requests are the bottleneck even with OPcache and Redis tuned, that is the signal to give the slice more CPU or memory. On a VPS that is one resize, not a migration, which is the quiet advantage of running the whole stack yourself.
Frequently asked questions
How much can I really speed up WordPress on a VPS with caching?
It depends on your traffic mix, but for anonymous page views the gain is large because a cached page skips PHP and the database entirely. On the small slice used for this tutorial, the same front page went from 26.71 to 524.43 requests per second under identical load, roughly twentyfold, with time-to-first-byte roughly halved. Logged-in and checkout traffic gains less, since those must run PHP every time, but OPcache and a Redis object cache still cut their work meaningfully.Do I need a caching plugin like WP Super Cache as well?
Not for page caching if you use the nginx FastCGI micro-cache in this tutorial, because nginx serves cached pages before PHP even starts, which is faster than any plugin that runs inside PHP. A plugin-based page cache is the right choice when you cannot edit the nginx config, such as on shared hosting. On a VPS you can, so let nginx do it. You do still want the Redis object cache plugin, which serves a different job: caching database objects, not whole pages.Will the micro-cache serve a logged-in user the wrong page?
Not if the skip rules are in place. The configuration here refuses to cache any request that carries a WordPress login cookie, any POST, and anything under wp-admin, so signed-in users and form submissions always hit live PHP. This is the single most important part to get right. Always test it by confirming that both wp-login.php and a logged-in dashboard return an X-Cache value of BYPASS before trusting the cache with real traffic.Is OPcache not already enabled on Ubuntu, so why tune it?
It is enabled by default, but its default ceilings of 128 MB and 10,000 files are sized for a small application, not a WordPress site with plugins. Once the file table fills, OPcache evicts and recompiles, which is the slow behaviour you wanted to avoid. Raising the memory and file limits, as this tutorial does to 192 MB and 20,000 files, keeps every WordPress and plugin file compiled and resident, which is where the steady 95-percent-plus hit rate comes from.Running WordPress on your own slice means the performance is yours to tune, layer by layer, with no per-site cache add-on to buy and no black box deciding what gets cached. When you are ready to give a slow site room to breathe, a ServerCake slice gives you a clean Ubuntu 24.04 box in India, billed in rupees with GST, ready for exactly the caching stack above.