What you will have at the end
Linux logging on a fresh Ubuntu server is scattered by design: some of it sits in the systemd journal, some in text files under /var/log, none of it central, and all of it hard to search at the moment you need an answer. This series changes that end to end.
By the end you can walk up to a server mid-incident and answer "what happened" instead of guessing. Your logs are structured instead of loose text, rotated so they never fill the disk, shipped to a central store that outlives the host, and queried down to the single failing request. An alert speaks up when errors spike, and the logs hold no personal data they should not, so the store an auditor asks about stays defensible under India's DPDP Act.
This first chapter is for an admin who is flying blind: the logs exist, but cannot be searched when it counts. It shows you the destination on a live Ubuntu 24.04 slice, the moment one query pulls the exact failing request out of the noise, then takes the first real step to bring logs under control and teaches the two systems every later chapter builds on.
- The series destination: scattered, unsearchable logs become a single precise query that returns the one error line, so at 2am you read the failure instead of scrolling for it.
- There is nothing to install to begin. journald and rsyslog already run on Ubuntu, so the from-zero step is making the journal persistent so a reboot stops wiping your history.
- journald is the systemd journal: a structured, indexed store you query with
journalctlby unit, priority, and time. rsyslog keeps the plain-text files under/var/logthat older tools tail. - One message reaches both, because journald forwards a copy to rsyslog, so you get indexed queries and file compatibility from the very same event.
- One Ubuntu 24.04 slice you reach over SSH with sudo. Both logging daemons already run on it, so this series is about controlling and reading logs, not installing a logging product.
- A small demo service,
sc-log-demo, that prints a steady mix of INFO, WARNING, and ERROR requests, so every query in the series has real errors to find rather than a contrived one. - No public port is opened in this chapter. Everything stays on the box:
journalctlreads the local journal andgrepreads local files. - Enough shell to read a
journalctlblock and run ajqfilter, which is the pair of skills the rest of the series leans on.
See the destination first
Here is where the series ends, on one screen, before any theory. A request has failed on the demo service and you need the failing line itself, not a scroll through thousands of healthy ones. This is one query against the journal, filtered to error priority and rendered as JSON so jq can reshape it into just the fields that matter.
journalctl -u sc-log-demo.service -p err -o json -n 1 \
  | jq '{time: (.__REALTIME_TIMESTAMP|tonumber/1000000|todate), pid: ._PID, msg: .MESSAGE}'
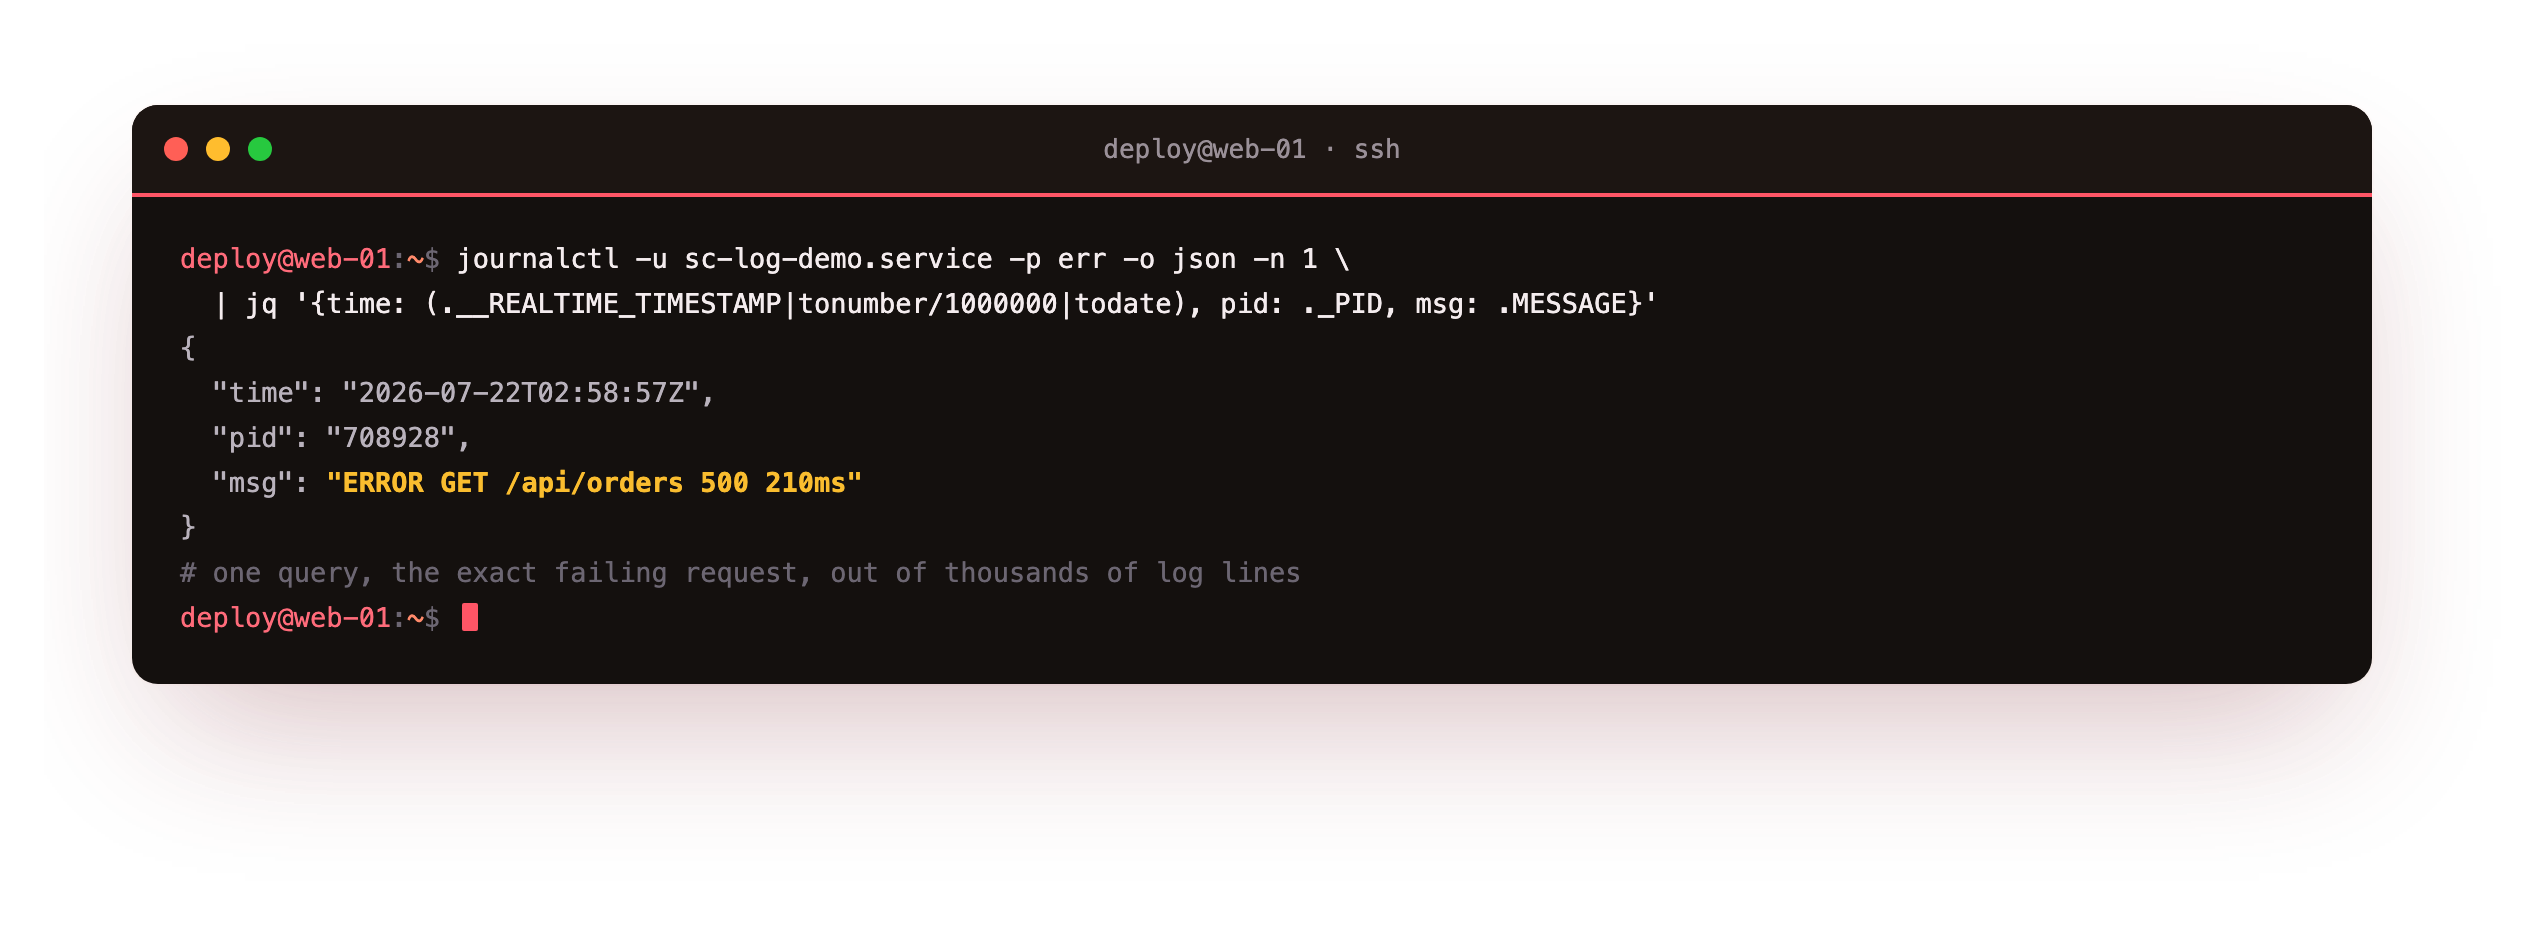
The -p err filter drops every INFO and WARNING line the service also wrote, so what is left is the failure: a 500 on /api/orders, with the exact time and the process id that served it. That is the point of the whole series in one command.
Right now you cannot do this on your own box. The journal is not kept across a reboot by default, the app logs plain text that no filter can key on, and nothing central holds a copy if the host dies. The rest of the series fixes each of those, and the first fix is the smallest one.
Get logs under control: make the journal persistent
There is nothing to install here. journald has been capturing your logs since the machine booted; the catch is where it keeps them. By default the journal can live only in memory under /run, which means a reboot, or the crash you most want to investigate, takes the evidence with it. The first real step to controlling logs is to pin the journal to disk so its history survives. A drop-in file under /etc/systemd/journald.conf.d/ is the clean way, since it leaves the shipped config untouched.
sudo mkdir -p /etc/systemd/journald.conf.d
printf '[Journal]\nStorage=persistent\n' | sudo tee /etc/systemd/journald.conf.d/99-sc-persistent.conf
sudo systemctl restart systemd-journald
ls -d /var/log/journal/*/
journalctl --disk-usage
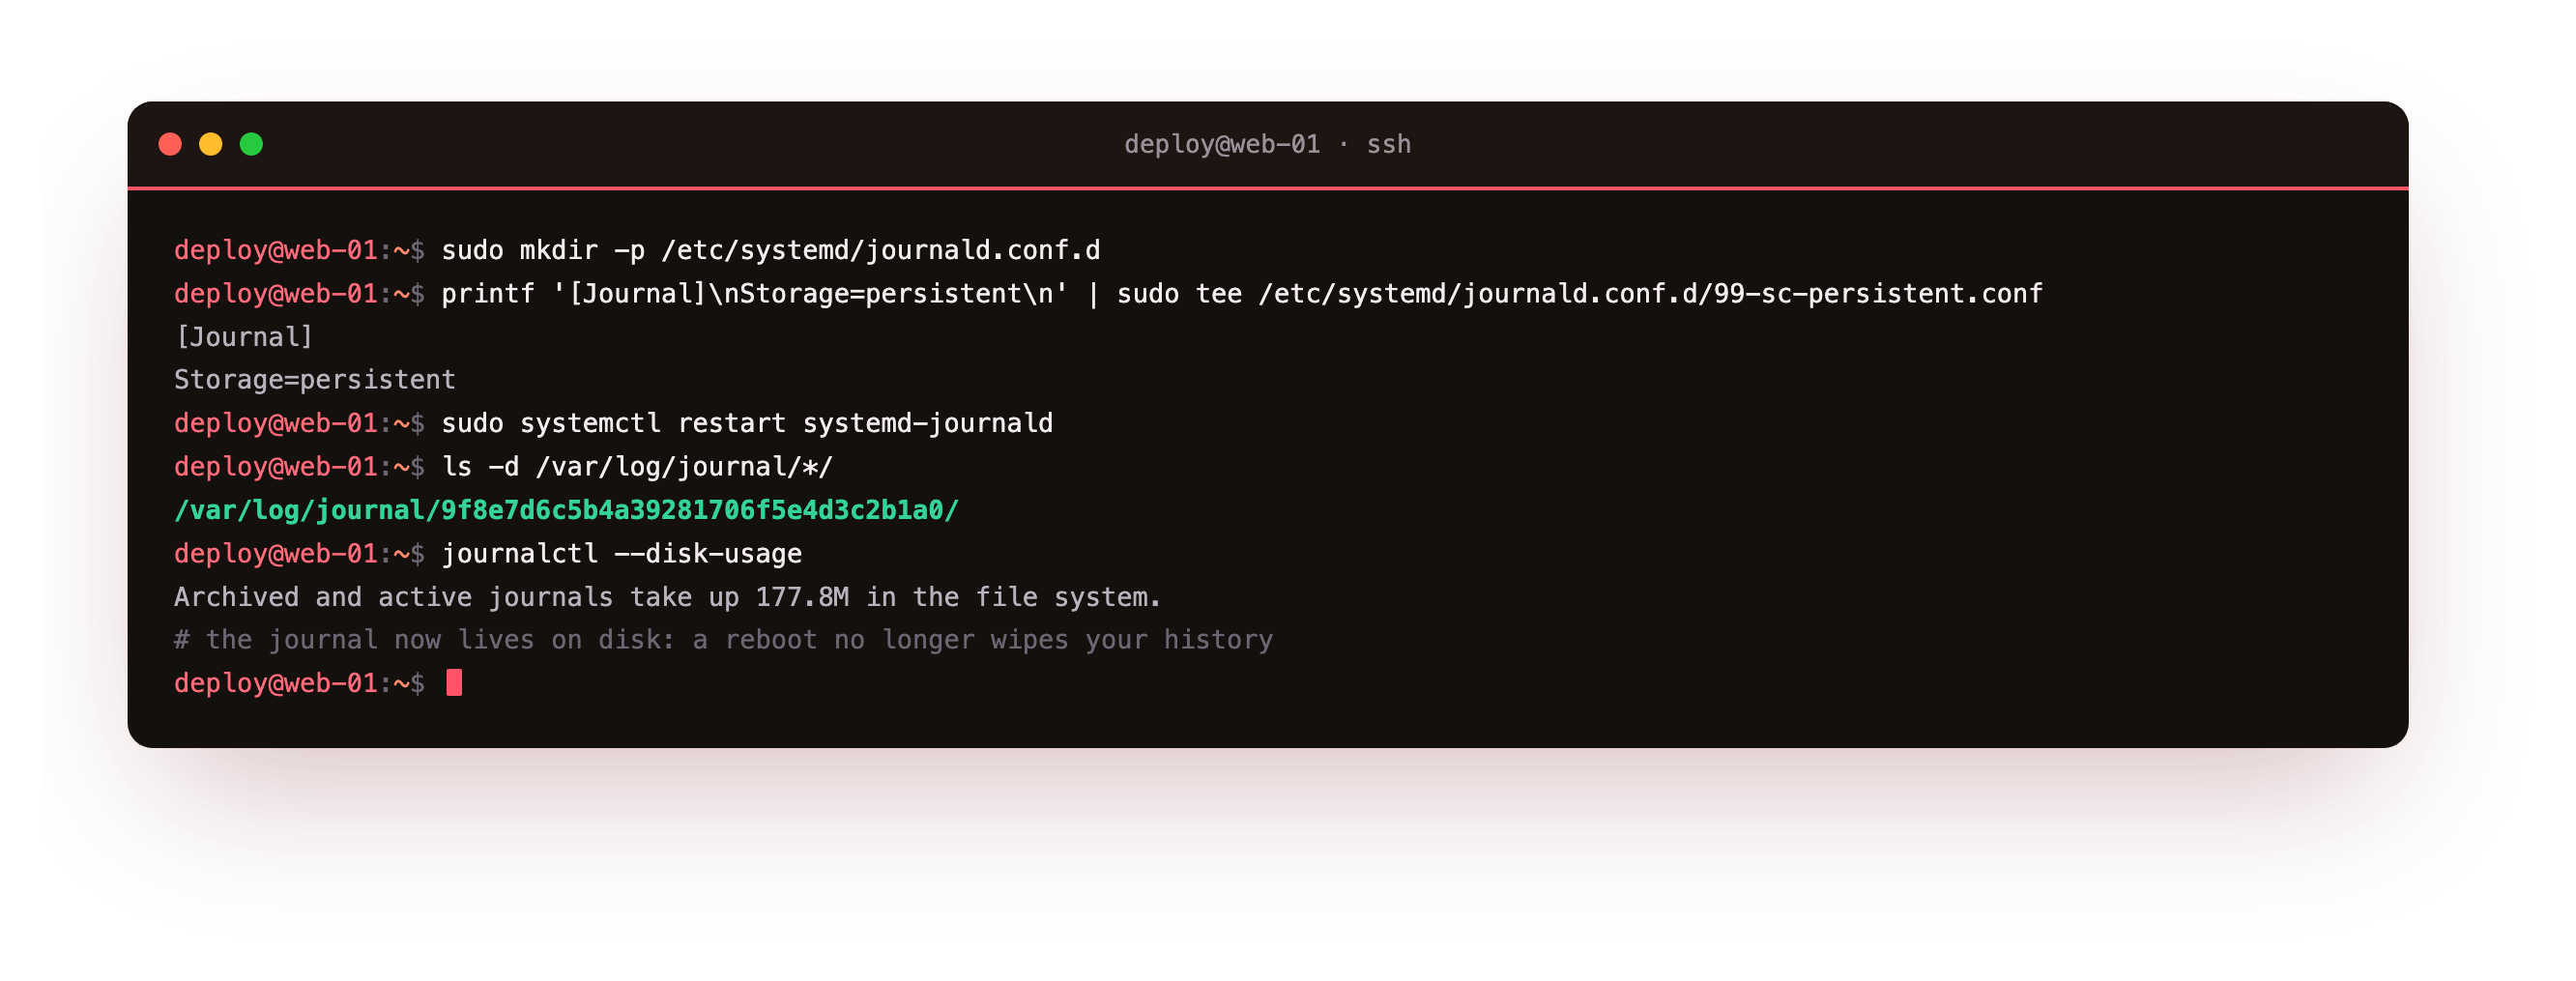
After the restart, journald creates /var/log/journal and writes there instead of in memory. The listing shows the per-machine directory it made, and --disk-usage reports what the stored journal now holds, around 178M on the test slice. From here a reboot no longer blinds you: the entry the destination query found above is on disk, ready for the same filter tomorrow.
Run ls /var/log/journal and confirm a directory named for the machine id is present. If it is, the journal is now persistent. If /var/log/journal is still missing, the storage mode did not take, so recheck the drop-in file and restart systemd-journald again.
How Linux logging works: two systems, one message
Now the model behind that query. A modern Ubuntu server runs two logging systems side by side, and they do different jobs. journald, part of systemd, keeps a binary, indexed store you read with journalctl; that is what the destination query searched. rsyslog keeps the plain-text files under /var/log, such as /var/log/syslog and /var/log/auth.log, that older tools and log shippers still read directly.
A service that only writes to standard output needs no logging library to appear in either. systemd captures that output into the journal and tags each line with the unit name, the process id, and a priority.
| Path | Written by | Read with |
|---|---|---|
/var/log/journal | systemd-journald | journalctl |
/var/log/syslog | rsyslog | less, grep, tail |
/var/log/auth.log | rsyslog | grep, log shippers |
Read the demo service through the journal first. The -u flag filters to one unit and -n limits how many recent lines you see.
journalctl -u sc-log-demo.service -n 6
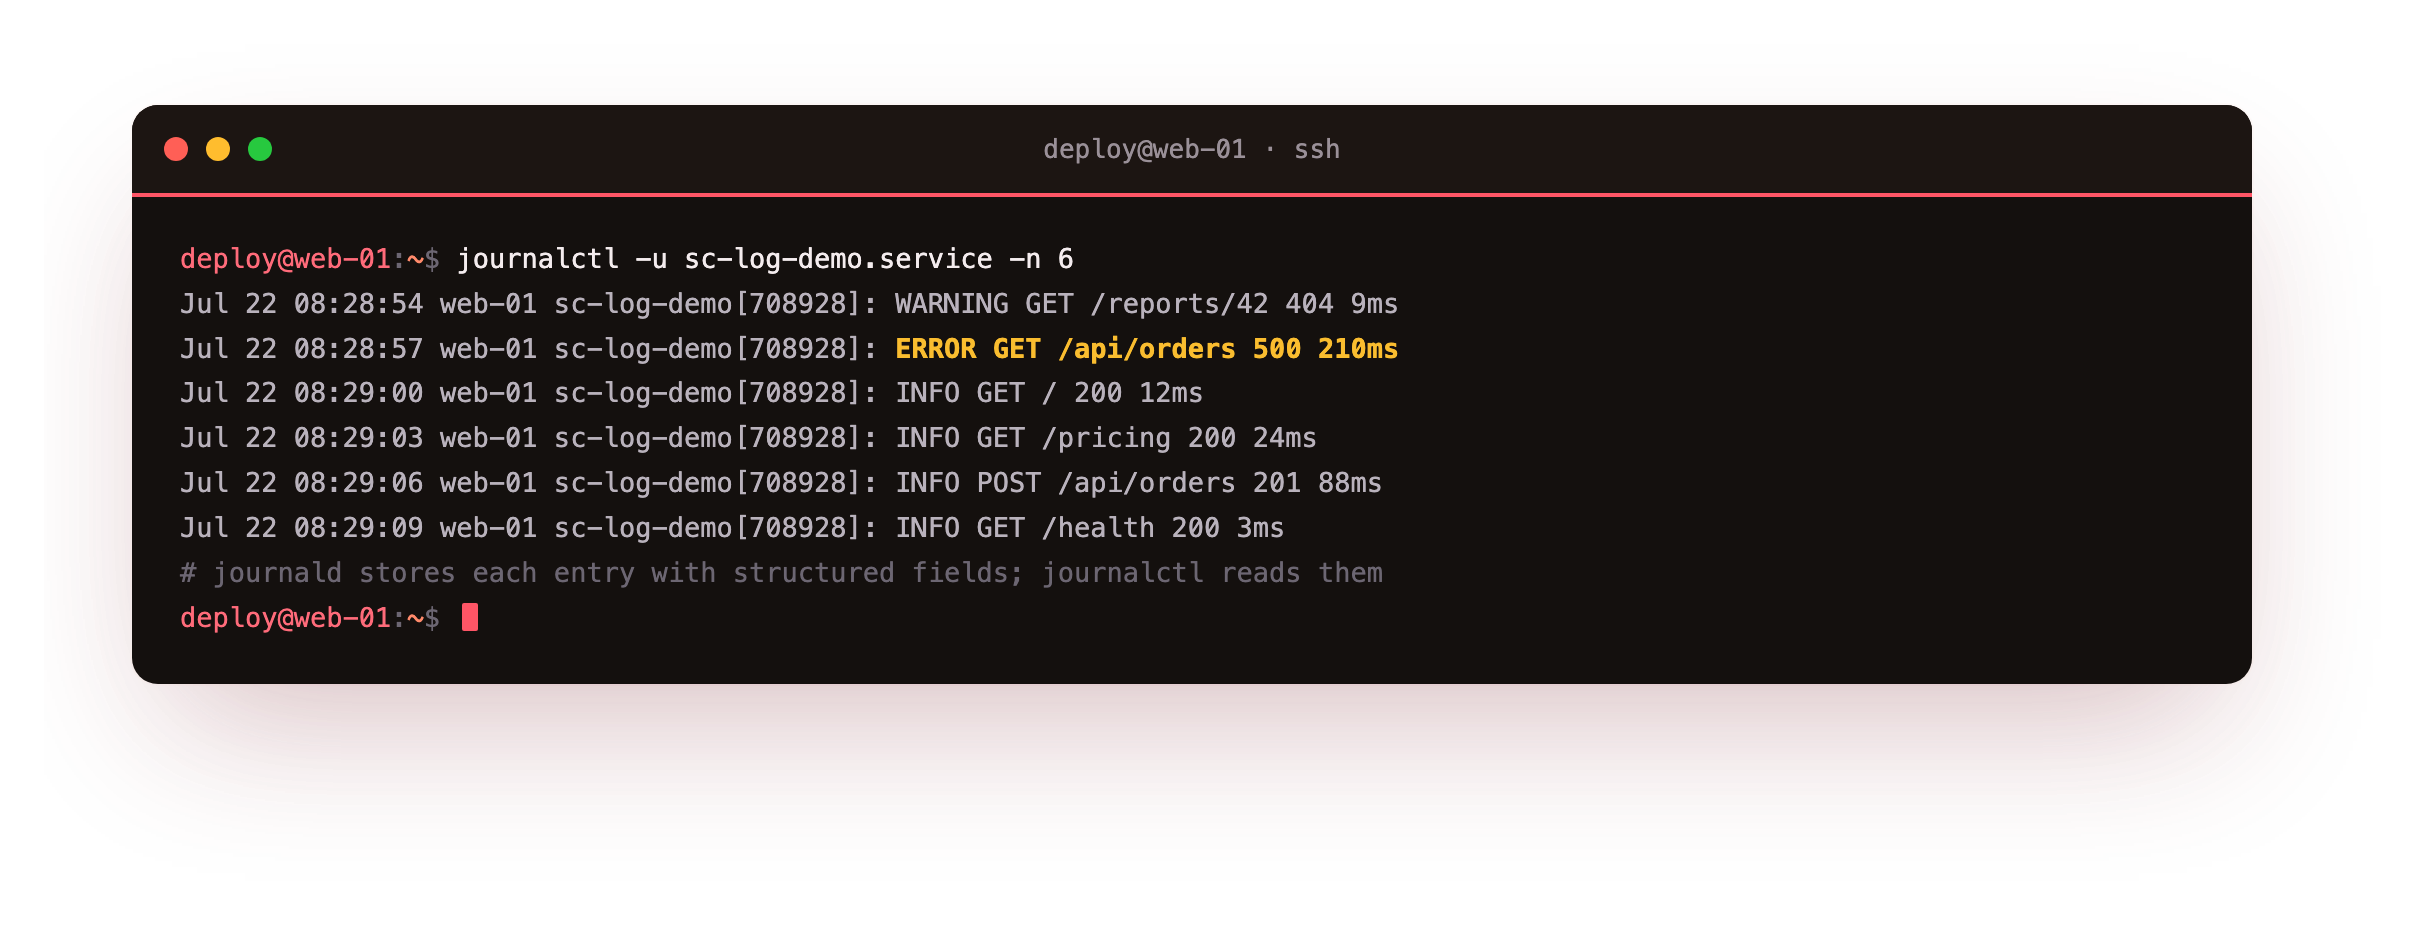
Each line carries a timestamp, the host, the unit's syslog identifier, the process id in brackets, and the message. Because journald stores structured fields rather than flat text, the same store also answers the -p err filter and the -o json reshaping you saw at the top. Those are not extra tools, just the same journal queried harder, which is exactly what the querying chapter leans on later.
You should see six recent entries for sc-log-demo: a mix of INFO, WARNING, and one ERROR from a simulated 500. If journalctl prints nothing, confirm the demo service is up with systemctl is-active sc-log-demo.service before moving on.
The same event in rsyslog
Now read the plain-text side. rsyslog receives a copy of each journal entry and writes it into /var/log/syslog, which is how a tool that only knows how to tail a file still works on a systemd host. Grep that file for the demo service to see the identical events as text.
sudo grep sc-log-demo /var/log/syslog | tail -6
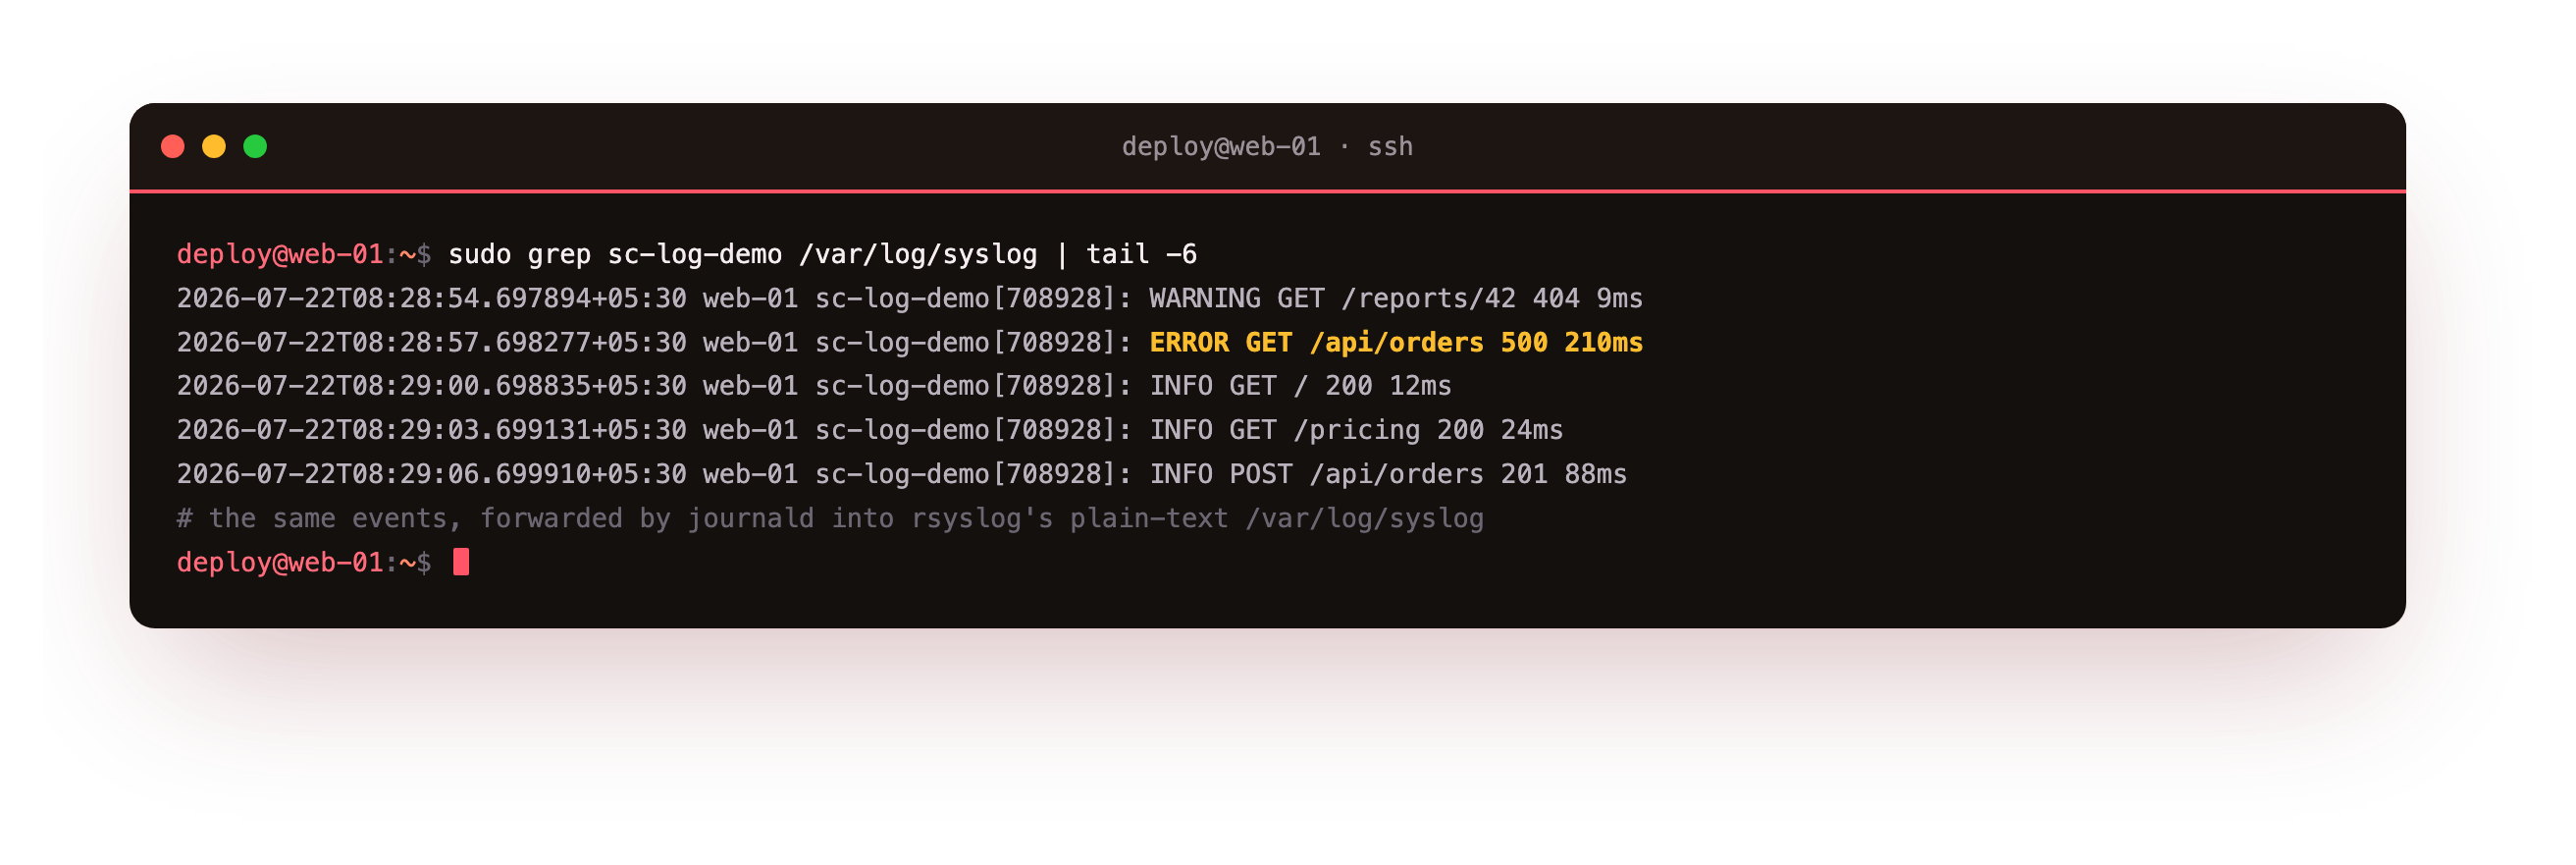
The messages match the journal line for line, with the same process id, so you can confirm both systems saw the same run. The timestamps here use the RFC 3339 format rsyslog writes by default. This is the from-zero end state for one host: the same event visible in journald and forwarded into the files, on a box whose journal you now keep on disk.
The grep should return lines whose process id matches the journalctl output above. The same pid in both places is the proof that journald forwarded the copy, rather than two systems logging the run independently.
Going further: how one message reaches both
journald receives every entry first, then forwards a copy to rsyslog through a local socket that rsyslog already listens on, which is why /var/log/syslog filled without any extra setup. The behaviour is controlled by ForwardToSyslog in journald.conf; leaving it on is what gives you indexed queries and file compatibility from the same event.
The journal also keeps its own size cap, separate from any file rotation, which the next chapter pins with SystemMaxUse so a busy service cannot fill the disk with history. For now the two ideas to hold are that the journal is the indexed source and the files are the compatible copy.
Frequently asked questions
Should I use journalctl or the files under /var/log?
Use whichever fits the task. journalctl is better for filtering by unit, priority, or time on the box itself, because the journal is indexed, which is why the destination query above reads the journal. The plain-text files are better when a tool or a log shipper wants to tail a stream, or when you want a quick grep. On Ubuntu you rarely have to choose, since the same message reaches both, and later chapters ship the structured version off the host.
Why does one log line appear in both the journal and /var/log/syslog?
systemd-journald receives the entry first, then forwards a copy to rsyslog through a local socket. rsyslog applies its rules and writes the text file. That copy is why you see the same process id and message in both. If you turned forwarding off, the journal would still record the entry but the syslog file would not, so a file-based tool would go blind. Keeping both is what gives you indexed queries and file compatibility at once.
Does a service need a logging library to be captured?
No. When a systemd service writes to standard output or standard error, journald captures those streams and stamps each line with the unit, the process id, and a priority. That is how the demo worker in this series is logged: it just prints. A library helps when you want structured fields or a specific format, which the next chapter adds with JSON, but a plain print is already enough to be recorded and queried.
Why make the journal persistent as the first step?
Because a journal that lives only in memory is wiped on reboot, and a reboot often accompanies the very incident you need to investigate. Setting Storage=persistent writes the journal to /var/log/journal so its history survives a restart. It is the cheapest possible move toward controlling logs: no install, one drop-in, one restart, and the box stops losing its own past.
What you can do now
You have seen the destination: one filtered, JSON-reshaped query that returns the single failing request. You made the journal persistent so a reboot no longer wipes it, and you traced one service run through both journald and rsyslog to see the same event in each. That is scattered logs brought under control and made readable on a single host.
The next step in the arc is to make the logs worth querying at that precision on any field, not just by priority. The next chapter gives the demo app a structured JSON format you filter with jq, then rotates the file with logrotate and caps the journal so neither store grows without bound: structured logging and log rotation.