Structured logging as JSON, read with jq
Structured logging means each log line is a machine-readable record, not a sentence. Instead of GET /api/orders 500, the app writes a JSON object with named fields: method, path, status, latency, user. That turns a log file into something you can query with jq the way you would query a table, and it makes the same data easy to ship and index later.
In the last chapter you made the journal persistent and could filter it by priority. This chapter goes further along the arc: it emits structured logging from the demo app on a live Ubuntu 24.04 server so you can query on any field, reads it with jq, then rotates the file with logrotate and caps the journal so neither store grows without limit.
- A JSON log line puts named fields on every event, so
jqcan filter and aggregate without fragile text parsing. jqselects records by condition, for example every request whose status is 500 or higher, and reshapes the output.- logrotate renames a log at a size threshold, keeps a set number of old copies, and compresses them to save disk.
- The journal has its own ceiling:
SystemMaxUsecaps the total, andjournalctl --vacuum-sizereclaims space now.
The demo worker writes each request as one JSON object to /var/log/sc-log-demo/app.log, alongside the plain line it sends to the journal. Both describe the same event; the file version is the one you query with jq.
Read the JSON with jq
A single record pretty-printed shows the shape. Pipe the last line through jq . to expand it, then use a filter to pull only the records that matter. The select filter keeps records that match a condition, so asking for server errors is one expression.
tail -1 /var/log/sc-log-demo/app.log | jq .
jq -c 'select(.status >= 500)' /var/log/sc-log-demo/app.log | tail -2
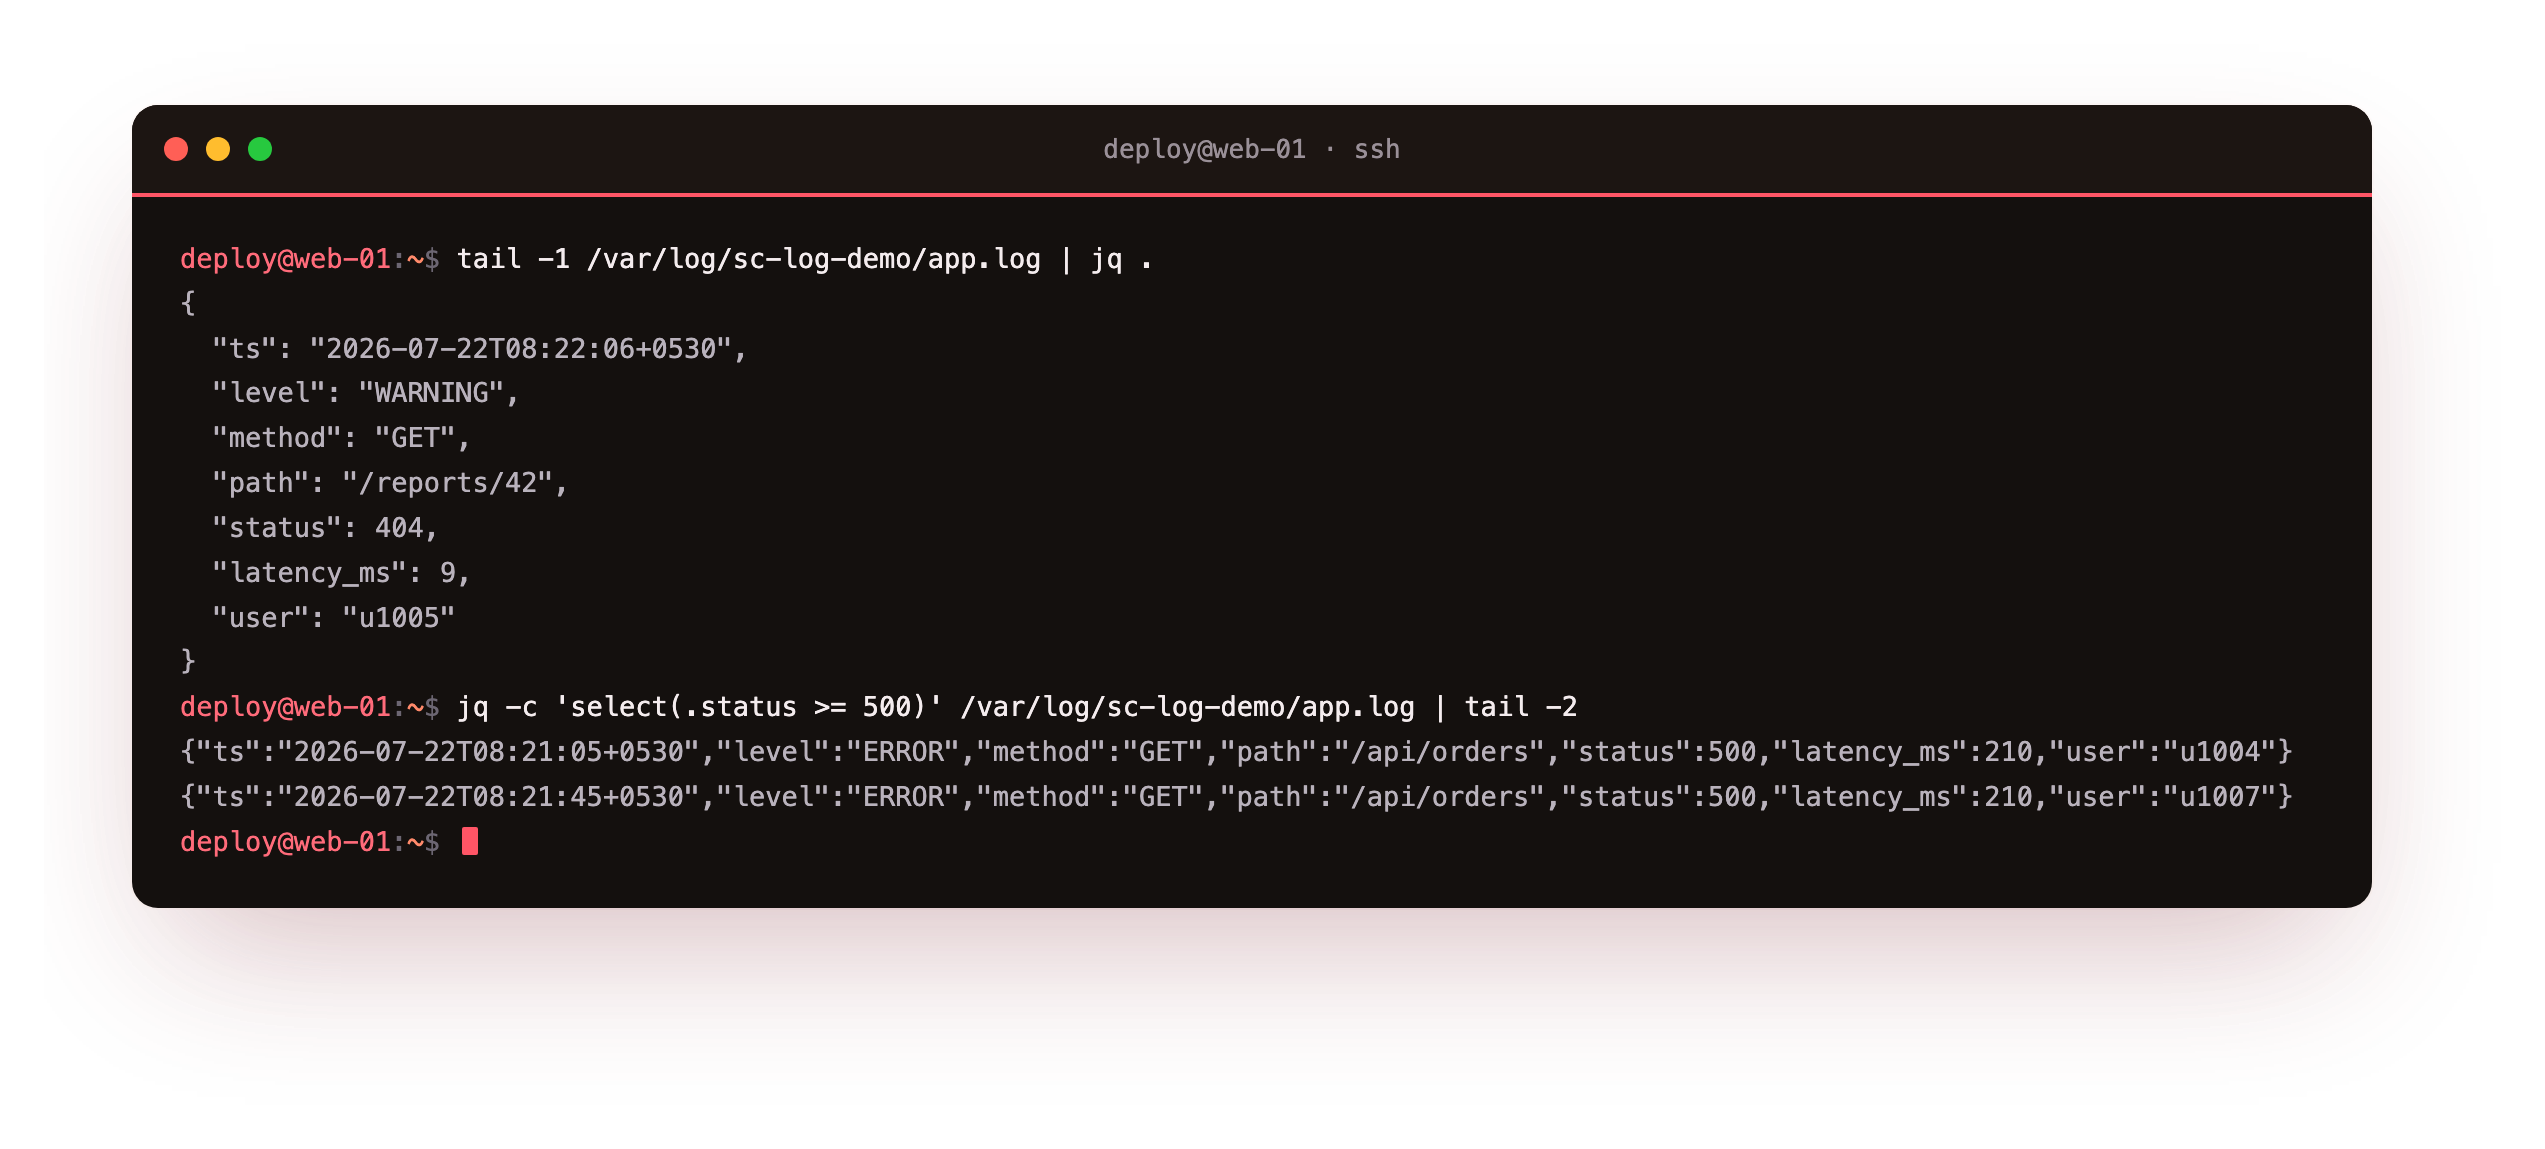
The pretty print lists every field on its own line. The select filter returns only the 500-status records, compact one per line, which is the set you would page on. Because the fields are named, you never parse column positions or split on spaces. You can extend the same idea to group by path or sum latency, which the querying chapter builds on.
The select query should print only records whose status is 500 or higher, one compact object per line, and nothing else. If it prints normal 200 traffic too, the app is not writing valid JSON per line, so check that each log line is a single well-formed object before moving on to rotation.
Rotate the file with logrotate
A file-based log grows until the disk is full unless something trims it. logrotate is the standard tool: it renames the current file, starts a fresh one, keeps a fixed number of old copies, and compresses the older ones. Drop a config for the demo file under /etc/logrotate.d/.
/var/log/sc-log-demo/app.log {
    size 20k
    rotate 7
    missingok
    notifempty
    compress
    create 640 root adm
    postrotate
        /bin/systemctl kill -s HUP sc-log-demo.service 2>/dev/null || true
    endscript
}
The size line rotates once the file passes 20k, rotate 7 keeps seven old copies, and compress gzips them. The create line sets ownership and mode on the fresh file. The postrotate block sends the app a HUP signal so it reopens its log handle onto the new file, which is the safe way to rotate a log an app holds open.
Force a rotation to prove it
You do not have to wait for the size trigger. The -f flag forces a rotation now, which is the quickest way to confirm the config works. Run it, then list the directory.
sudo logrotate -f /etc/logrotate.d/sc-log-demo
ls -lh /var/log/sc-log-demo/
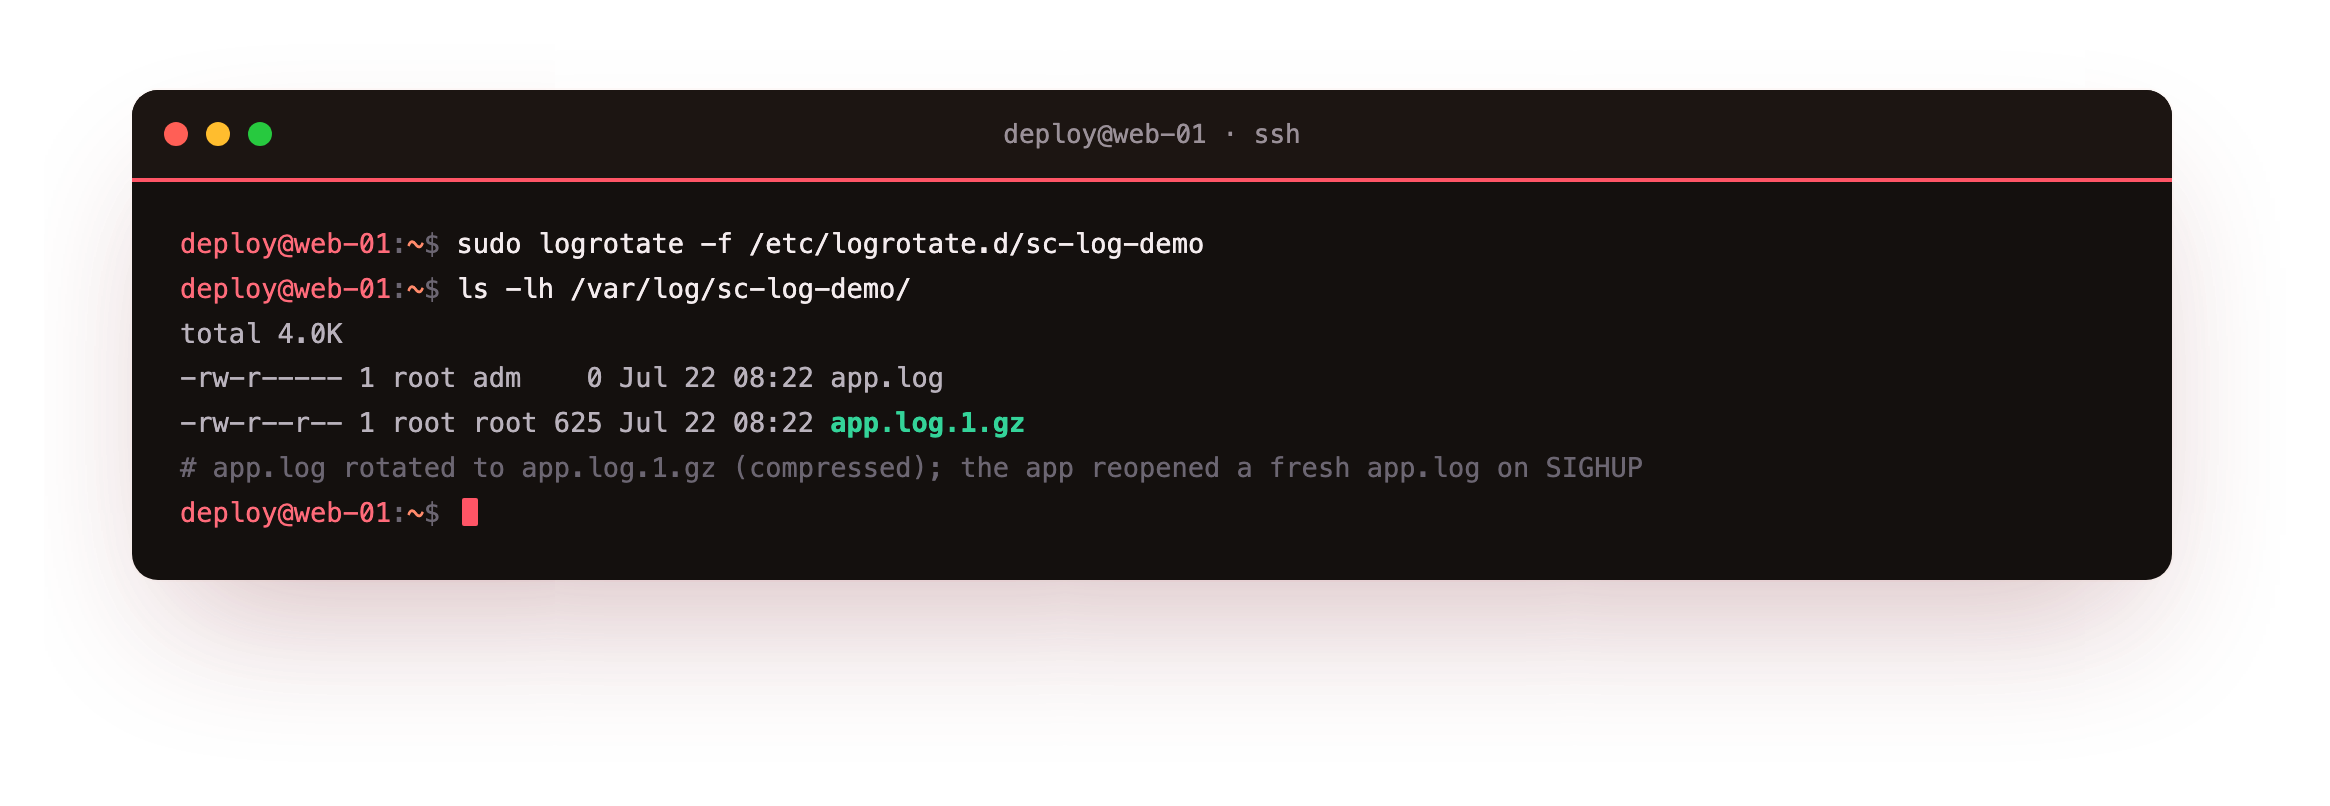
The listing shows app.log back at zero bytes and a new app.log.1.gz holding the compressed previous contents. The mode is 640 owned by root:adm, exactly what the create line asked for. The app kept writing without a restart because the HUP made it reopen the fresh file. That is a full rotation, verified on the server, not a dry run.
After the forced run you should see app.log at zero bytes and a fresh app.log.1.gz beside it. If the compressed copy is missing, the config path or the file glob is wrong, so confirm the drop-in lives at /etc/logrotate.d/sc-log-demo and points at the real log path.
Cap the journal too
logrotate handles the text file, but the journal has a separate budget. Pin a ceiling with SystemMaxUse in a drop-in, then reclaim space on demand with a vacuum. The vacuum deletes whole archived journal files until the total fits.
printf '[Journal]\nSystemMaxUse=200M\n' | sudo tee /etc/systemd/journald.conf.d/99-size.conf
sudo systemctl restart systemd-journald
sudo journalctl --vacuum-size=150M
The vacuum prints each archived file it removes and the space it frees. On the test server it freed about 13M in one pass and left the active journal in place. Between the file cap from logrotate and the journal cap from SystemMaxUse, a busy service can log all it wants without filling the disk.
Frequently asked questions
Why log JSON instead of plain text lines?
Plain text reads well to a human but is fragile to parse, because a small format change breaks every script that split on spaces. JSON puts a name on each value, so jq and log shippers read fields directly and ignore ones they do not need. You can still print a readable line to the journal for quick eyes-on debugging, and write the JSON to a file for querying and shipping. The demo app does both, from the same event.
What does the postrotate HUP actually do?
An app that opens its log file once holds a file descriptor to it. After logrotate renames the file, that descriptor still points at the old, now-renamed file, so new writes land in the wrong place. Sending SIGHUP tells the app to close and reopen its log path, which lands writes in the fresh file. The demo worker handles HUP by reopening. If an app cannot reload, copytruncate is the fallback, at the cost of a small race.
Should I use compress or delaycompress?
Both compress old copies; the difference is timing. Plain compress gzips the just-rotated file immediately, which is fine when the app has already reopened a new one. delaycompress waits one cycle before compressing, which avoids touching a file a slow writer might still be finishing. For a log an app reopens cleanly on HUP, plain compress is simple and the demo uses it. Add delaycompress if a writer can lag behind the rotation.
Does logrotate rotate the journal as well?
No. logrotate manages files under /var/log that a program appends to, such as the JSON file here. The systemd journal manages its own rotation and retention internally, so you control it with SystemMaxUse, MaxRetentionSec, and the vacuum commands rather than with logrotate. Treat them as two separate budgets: one for the text files, one for the journal. The retention chapter sets both to a policy.
What you have, and what comes next
The demo app now writes structured logging as JSON that jq queries by field, and both stores are bounded: logrotate keeps the file to seven compressed copies, and SystemMaxUse plus a vacuum keep the journal inside 200M. You forced a rotation and watched app.log.1.gz appear, so the config is proven on Ubuntu 24.04.
So far everything stays on one host. The next chapter ships a log line off the source and into a central collector over the network, then queries it back from the central store to prove it arrived.