From querying logs to log alerting
Logs are only useful when you can ask them questions and be told when the answer is bad. That pairing, querying plus log alerting, is the payoff the series promised in chapter one, and this chapter delivers it on a live Ubuntu 24.04 server after the persistent, structured, rotated, centralized logs you built.
First the queries you reach for by hand, filtering the journal by priority and time and the JSON file by field, then the alert itself: a small script that counts errors in a window and fires when they cross a threshold. The demo service keeps producing a steady trickle of 500 responses, so there are real errors to find and to alert on.
journalctl -p err --sincefilters the journal to error-priority entries inside a time window, which is the query to run first in triage.jqaggregates the JSON file by field, so you can count events per level or per path without parsing text.- A log alert is a scheduled query with a threshold: count matching events, and act only when the count is high enough.
- A good alert also stays silent on a quiet window, so it signals a real change rather than firing constantly.
For the journal to answer a priority query, the service has to log real priorities. The demo worker prefixes each line with a systemd priority code, so an ERROR line is recorded at error priority rather than as plain output, and -p err finds it.
Query the journal and the JSON file
Two queries cover most triage. The first pulls error-priority entries from the journal for the last ten minutes. The second uses jq to count records in the JSON file by level, so you see the ratio of errors to normal traffic at a glance.
journalctl -u sc-log-demo.service -p err --since "10 min ago"
sudo jq -r '.level' /var/log/sc-log-demo/app.log | sort | uniq -c
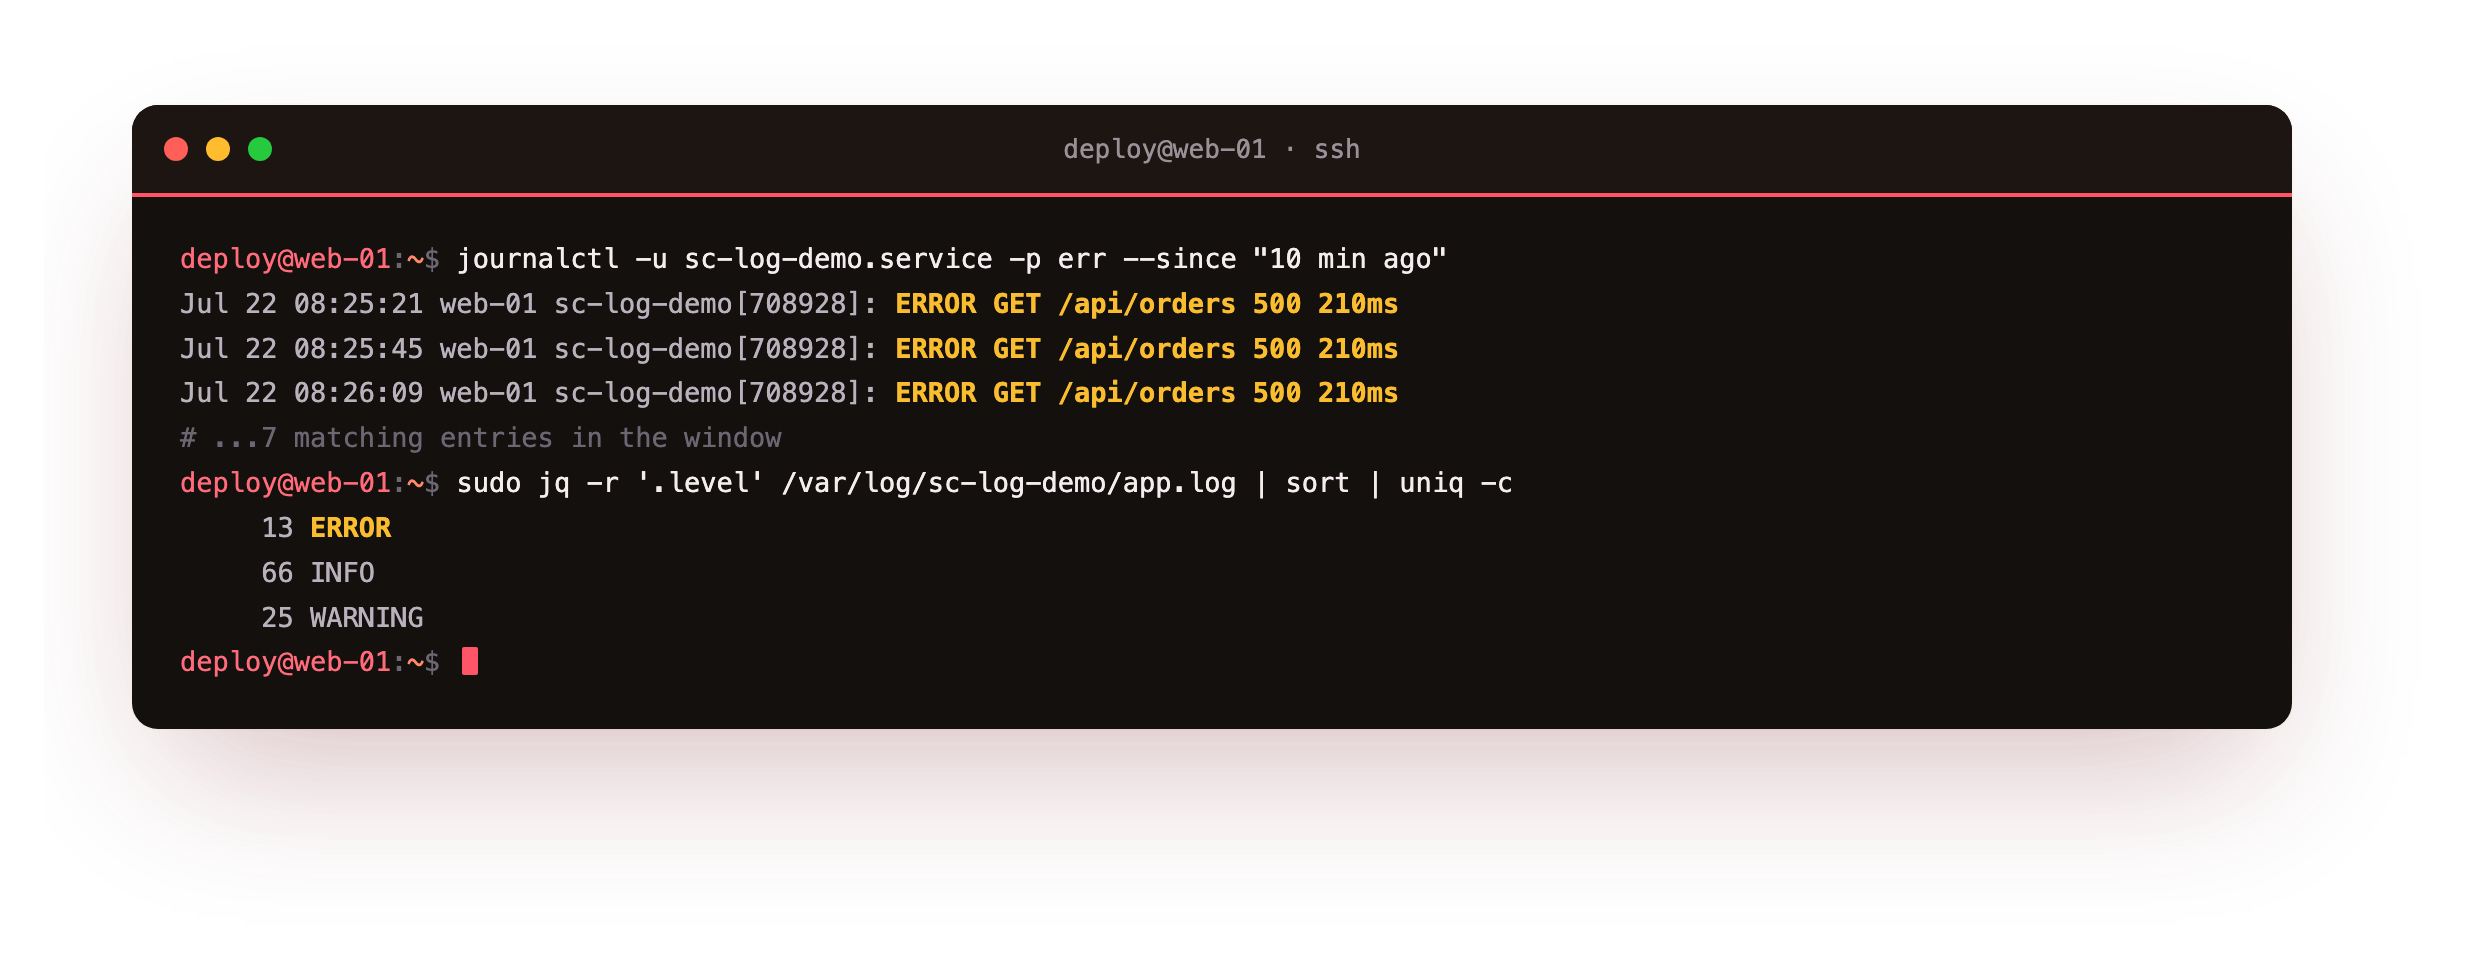
The journalctl query returns only the ERROR lines from the window, seven on the test run, each a 500 on /api/orders. The jq count shows the shape of the traffic: many INFO, some WARNING, a smaller band of ERROR. Reading them together tells you both what is failing and how often, which is the judgment an alert needs to automate.
The priority query should return only ERROR-priority lines from the window, and the jq count should show ERROR far below INFO. If -p err returns nothing while errors are clearly in the file, the app is not stamping a real priority, so it is writing ERROR as plain text: fall back to grep ERROR until the service sets a priority code.
Write a threshold alert
An alert is that same query with a decision attached. The script below counts error-priority entries for the service in a window, prints the count, and exits with a distinct status when the count reaches a threshold. That non-zero exit is what a timer, cron job, or monitoring agent keys off to notify someone.
#!/usr/bin/env bash
set -euo pipefail
UNIT="sc-log-demo.service"
SINCE="${1:-5 min ago}"
THRESHOLD="${2:-5}"
count=$(journalctl -u "$UNIT" -p err --since "$SINCE" --no-pager | grep -c "ERROR" || true)
printf 'errors for %s since "%s": %s (threshold %s)\n' "$UNIT" "$SINCE" "$count" "$THRESHOLD"
if [ "$count" -ge "$THRESHOLD" ]; then
    printf 'ALERT: %s error rate high (%s errors >= %s)\n' "$UNIT" "$count" "$THRESHOLD"
    logger -p local0.err -t log-alert "error rate high: $count errors since $SINCE"
    exit 2
fi
printf 'OK: below threshold\n'
When it fires, the script also sends its own line on the local0 facility, so the alert itself flows into the central pipeline from the previous chapter. Schedule it with a systemd timer every minute or two and you have log alerting with nothing installed beyond what the base system ships.
Watch it fire, then stay quiet
Run the alert twice to see both outcomes. First over a ten-minute window where the errors live, then over a five-second window where none do. A trustworthy alert has to do both: fire on the real condition and stay silent otherwise.
sudo /opt/sc-log-demo/log-alert.sh "10 min ago" 5
echo "exit: $?"
sudo /opt/sc-log-demo/log-alert.sh "5 sec ago" 5
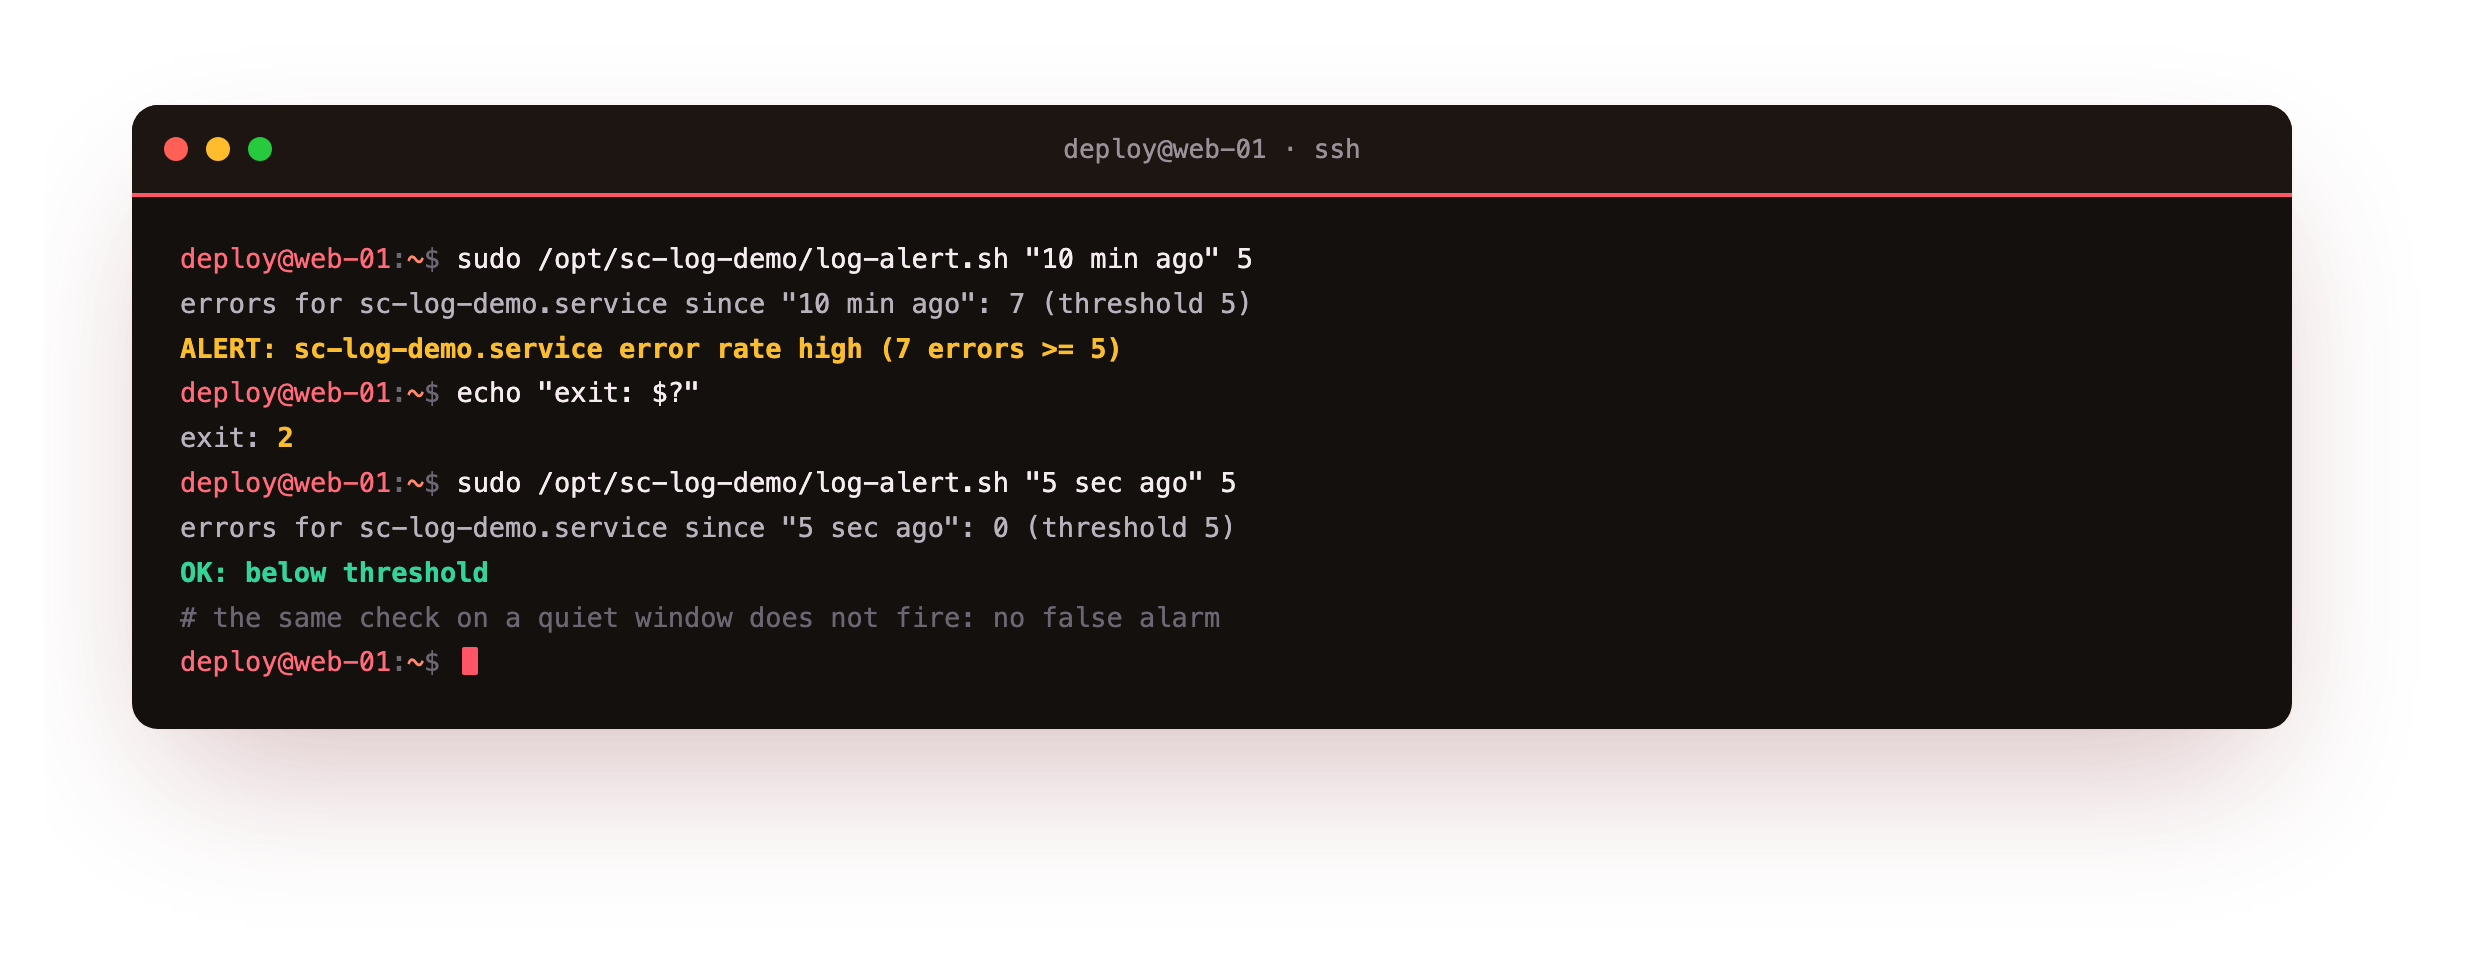
The first run counts seven errors, prints the ALERT line, and exits 2, which is the signal a scheduler turns into a page or a message. The second run counts zero and reports OK below threshold with a clean exit. That quiet result is as important as the loud one, because an alert that fires on every run is noise people learn to ignore.
You should see two different outcomes from the same script: an ALERT and exit 2 over the busy window, then OK and a clean exit over the quiet one. If both windows fire, the threshold is below your normal error rate, so raise it until an ordinary minute stays silent and only a real spike trips it.
Frequently asked questions
Why does journalctl -p err need the app to set priorities?
When a service just prints to standard output, systemd records those lines at the default info priority, so -p err would not match them even if the text says ERROR. To record a real priority, the app either uses the journal library or prefixes each line with a systemd priority code, which the demo worker does. Then -p err, -p warning, and friends filter correctly. Without that, you fall back to grepping the message text for a word like ERROR.
Should the alert read the journal or the JSON file?
Either works; pick by what you already trust. Reading the journal with -p err uses the priority systemd recorded, which is convenient on the same host. Reading the JSON file with jq lets you alert on any field, such as status codes or latency over a limit, and it works wherever the file is shipped. The demo alert reads the journal for simplicity. For a field-level rule, swap the count line for a jq filter.
How do I schedule the alert to run on its own?
Wrap it in a systemd timer that runs every minute or two, or a cron entry if you prefer. The script exits non-zero when it fires, so the timer's service can trigger a notification on failure, or the script can send the message itself as it already does on the local0 facility. Keep the window a little longer than the run interval so a burst is not missed between runs, and tune the threshold to your normal error rate.
How do I avoid alert fatigue from a noisy service?
Set the threshold above the normal background rate so ordinary noise does not trip it, and use a window that smooths short spikes. Alert on a rate over a few minutes rather than a single error, and consider a higher bar for paging than for a logged warning. The quiet-window test in this chapter is the habit to keep: before you trust an alert, confirm it does not fire when nothing is wrong.
What you have, and what comes next
You can now query the journal by priority and time, aggregate the JSON file by field with jq, and run log alerting that fires on an error threshold and stays quiet otherwise, all on Ubuntu 24.04. The alert exits with a signal a scheduler can act on and feeds its own line back into the central pipeline.
The last chapter turns these pieces into policy: how long to keep logs, how to cap disk use, how to keep secrets and personal data out of the logs, and how to protect the files so a record cannot be quietly rewritten.