Reload gunicorn with a graceful reload
A gunicorn graceful reload replaces every worker with a fresh one while the master keeps the listening socket open, so a request loop stays at 200 throughout. That is how you ship new code or a rotated secret without a maintenance window. This chapter drives a real reload under load, adds a health check endpoint, and turns the app's boot line into structured JSON that journald can index. Every command ran on a live Ubuntu 24.04 server, and the request loop across the reload dropped nothing.
- SIGHUP tells the gunicorn master to start new workers and retire the old ones, while it holds the socket the whole time.
- Wire it to systemd with ExecReload, so systemctl reload does the graceful swap and the master PID never changes.
- A health check should report more than up or down: include memory and uptime so a monitor can act on real signals.
- Structured JSON logs to journald are machine-readable, so you can filter and parse them instead of grepping free text.
The --reload flag that watches files is for development, not production, because it restarts on every save and is not meant for load. The production tool is SIGHUP, a signal the gunicorn master handles by cycling its workers gracefully. In-flight requests on old workers finish; new requests go to new workers.
Prerequisites
- The
flaskappservice from earlier parts, behind nginx with five workers. - An
ExecReloadline in the unit, shown below, so systemctl can trigger the reload. - A second terminal, or a backgrounded loop, to send traffic during the reload.
Wire the reload into systemd
Add an ExecReload line to the unit so systemctl reload sends SIGHUP to the master. The master PID stays the same across a reload, which is the signal that this is a graceful worker swap and not a full restart.
[Service]
ExecReload=/bin/kill -s HUP $MAINPID
With that in place, run a loop of requests through nginx while you reload the service twice. Count the HTTP codes at the end, and read the journal to see the master handle the signal.
for i in $(seq 1 200); do
  curl -s -o /dev/null -w "%{http_code}\n" http://127.0.0.1:8095/api/status
  sleep 0.03
done &
sudo systemctl reload flaskapp
sudo systemctl reload flaskapp
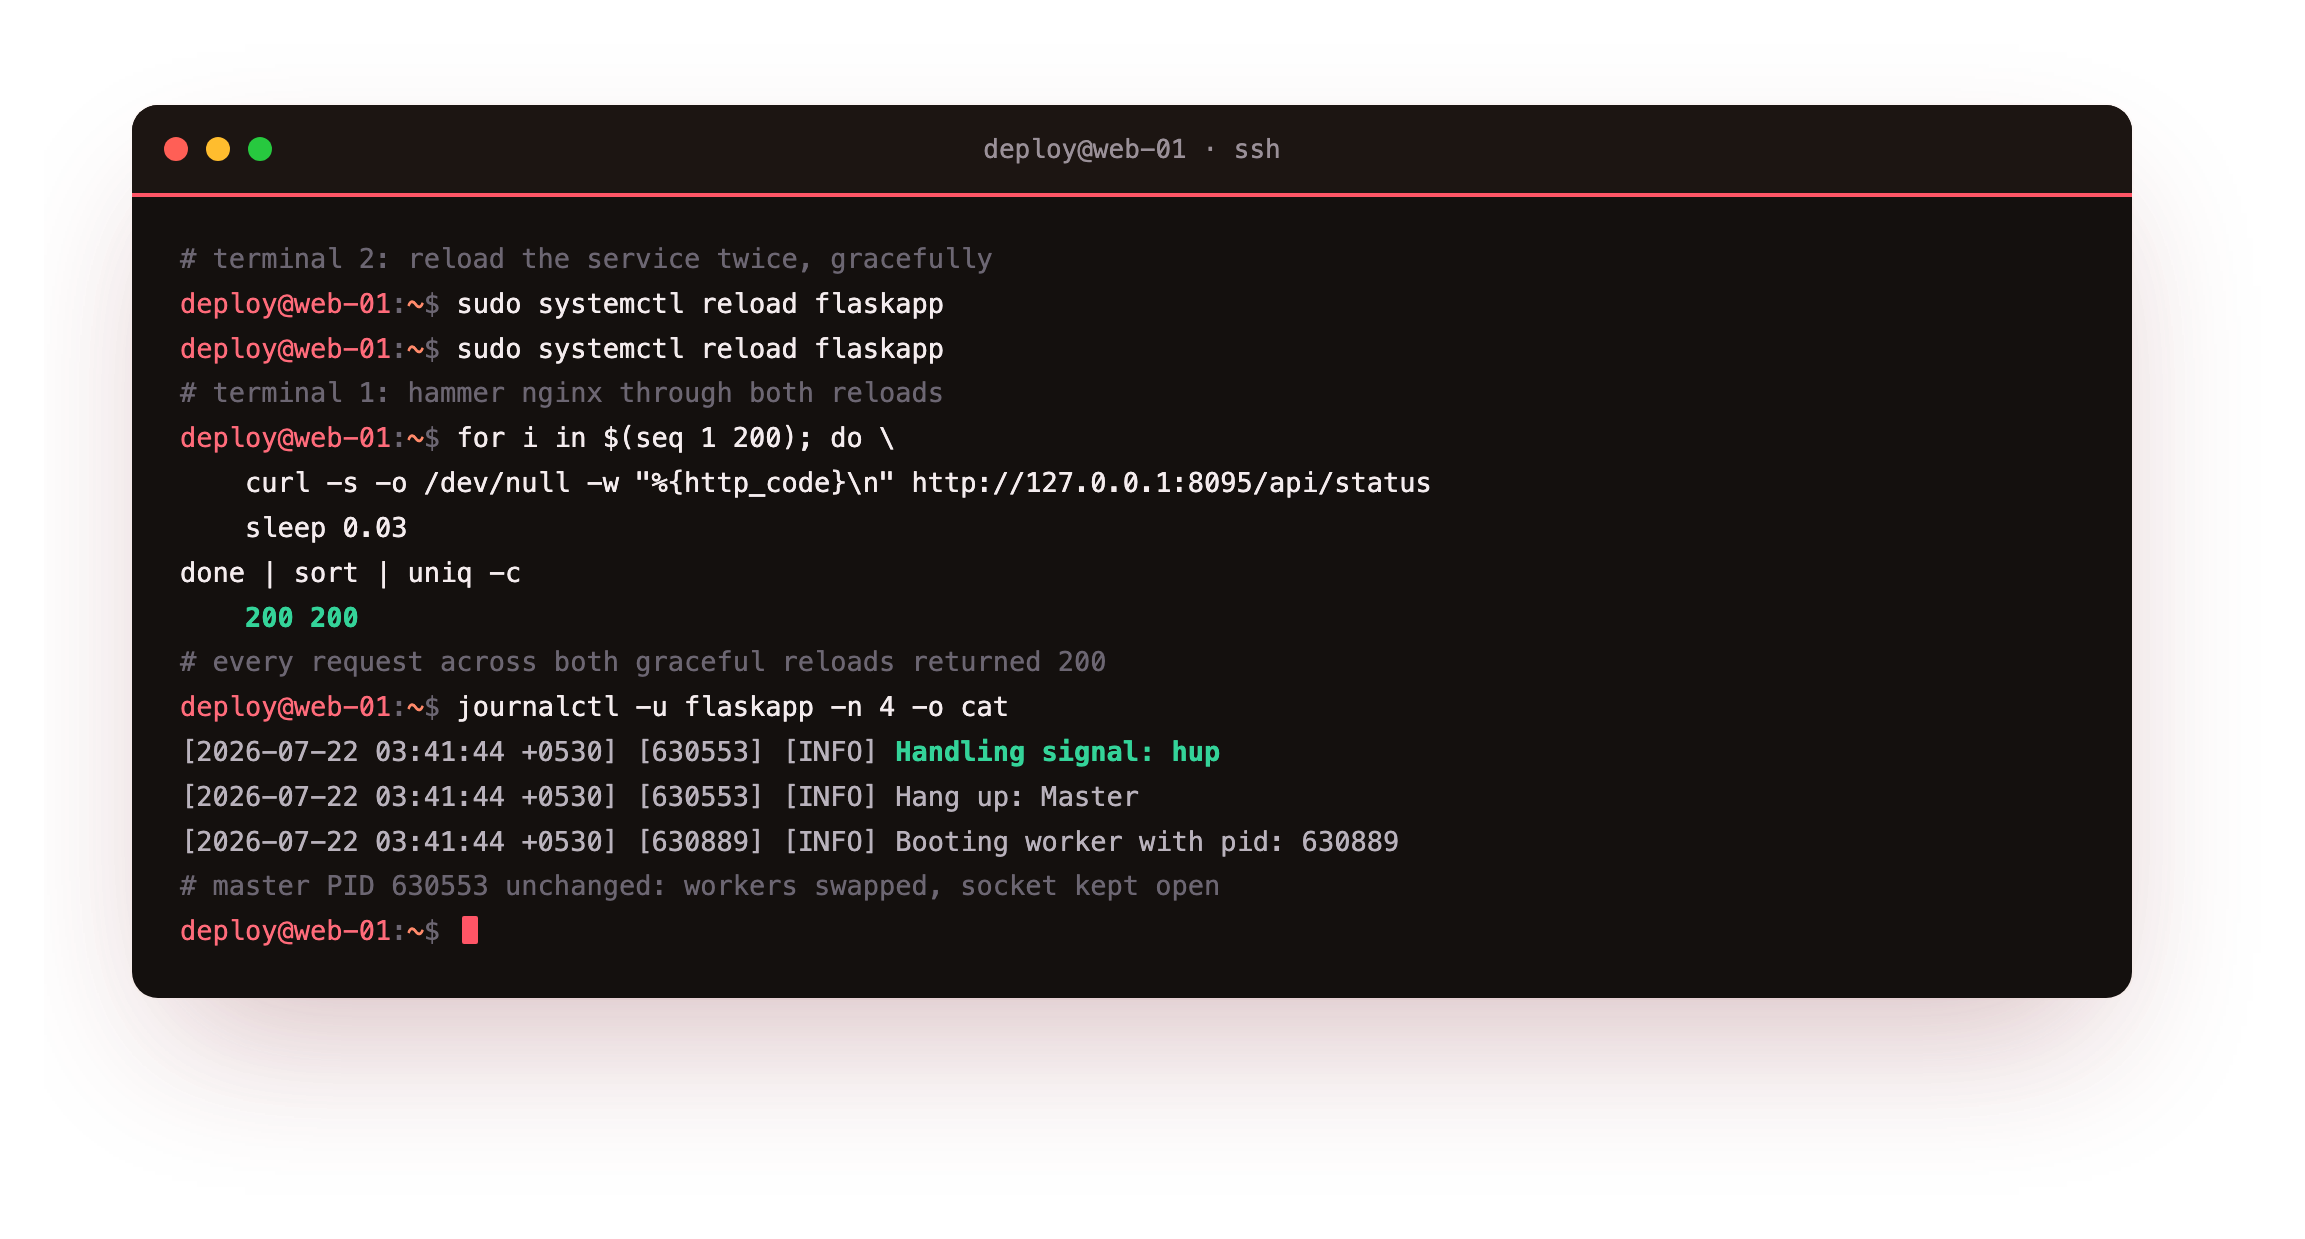
Every one of the 200 requests returned 200, across two reloads. The journal shows the master handling signal: hup and booting new workers, while its own PID never changes. Old workers drain their current request and exit; new workers take over. No connection was refused.
The tally of HTTP codes should read 200 for all 200 requests, and systemctl show -p MainPID --value flaskapp should return the same PID before and after the reload. A changed master PID means it restarted rather than reloaded, so confirm the ExecReload line is in the unit.
Add a real health check
A health endpoint that only returns 200 tells a monitor the process is up, not whether it is healthy. Return uptime and resident memory too, so a check can alert on a worker that is alive but bloated or stuck.
@app.get('/health')
def health():
    return jsonify(status='ok', pid=os.getpid(),
                   uptimeSec=round(time.time() - START),
                   rssMb=round(rss_bytes() / 1048576, 1))
Curl the endpoint through nginx and read the JSON back.
curl http://127.0.0.1:8095/health
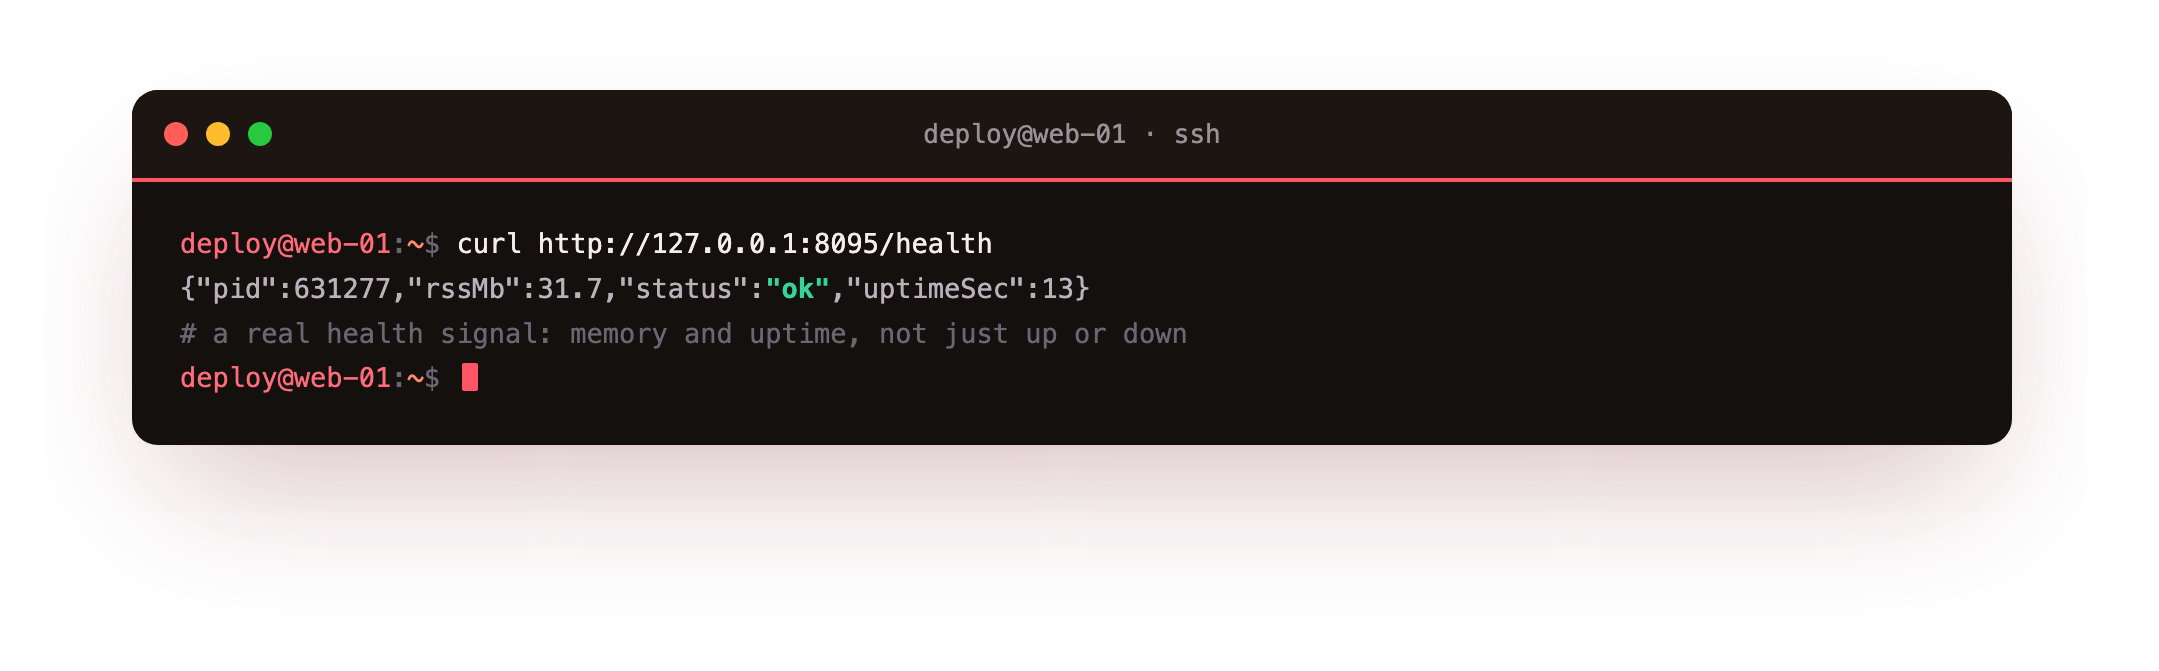
The response reports status ok, the worker PID, uptime in seconds, and resident memory in megabytes. A monitor can now do more than ping: it can page you when memory climbs past a threshold or when uptime resets unexpectedly, which points at a crash loop.
Expose metrics and structured logs
A small metrics endpoint in Prometheus text format lets a scraper track memory and uptime over time. Serve it alongside health, and make the app's boot line structured JSON rather than free text, so journald holds records you can parse.
curl http://127.0.0.1:8095/metrics
journalctl -u flaskapp -o cat -n 1 | jq .
curl -o /dev/null -w "%{http_code}\n" http://127.0.0.1:8095/health
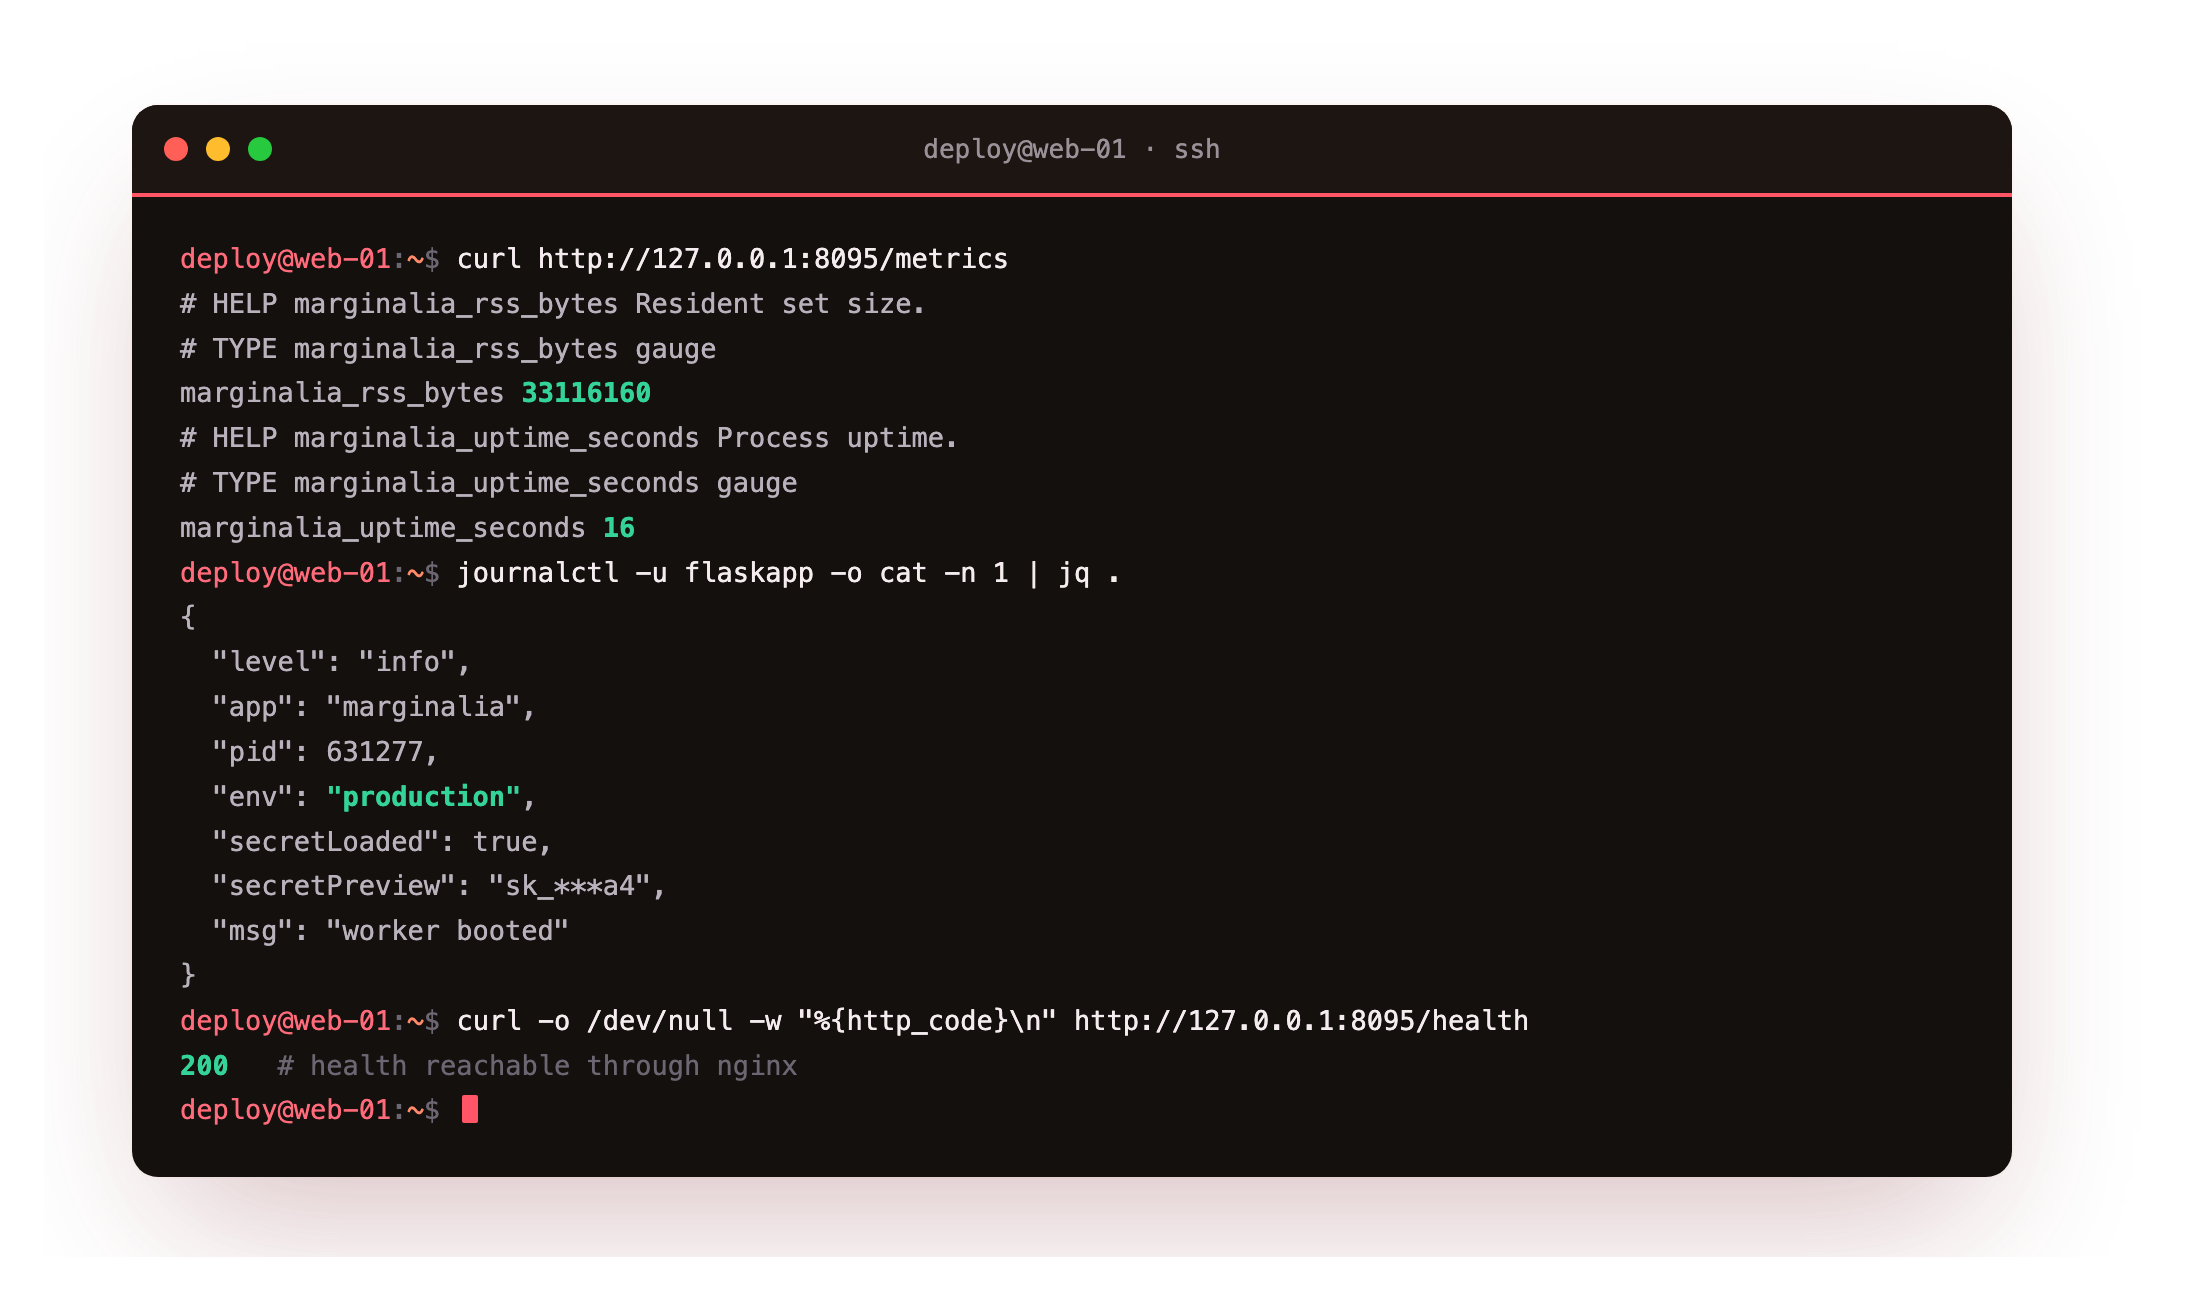
The metrics endpoint returns gauges for resident memory and uptime with their help text. The boot line parses cleanly as JSON through jq, showing the environment, that the secret loaded, and its masked preview. The final curl confirms the health route answers 200 through nginx, the same path a real monitor would take.
- reload (SIGHUP): the master stays, workers are swapped gracefully, no request is dropped. Use for new code and config.
- restart: the master and workers all stop and start, so there is a brief gap. Use when you change the unit or gunicorn itself.
- If you must restart with zero gap, run two instances behind nginx and restart them one at a time.
Frequently asked questions
Does a SIGHUP reload pick up new code?
Yes, unless you enabled preload_app. On SIGHUP the master re-forks workers, and each new worker imports your app fresh, so changed code and a re-read config take effect. With preload_app on, the app is imported once in the master, so a plain reload does not re-import it; there you restart the service instead. Without preload, the graceful reload is enough for a normal deploy.
What should a load balancer check, health or the app route?
Point the check at the dedicated /health route, not the home page. A lightweight endpoint avoids running your full request path and its database calls on every probe, and it lets you return an unhealthy status deliberately, for example while a worker warms up. Keep the check cheap and specific, so a slow home page never takes an otherwise healthy instance out of rotation.
Why structured JSON logs instead of plain text?
Plain log lines are readable but hard to query, so you end up grepping and hoping the format never drifts. JSON lines carry named fields, so journald and any log pipeline can filter by level, request id, or status without fragile pattern matching. The cost is one formatter in the app. For a service you will operate for a year, the queryability pays for itself the first time you debug an incident.
Do I need Prometheus to expose a metrics endpoint?
No. The endpoint is just text in a known format, so you can read it with curl or point any compatible scraper at it later. Exposing it early costs little and means the data is there when you add monitoring. If you do run Prometheus, the Metrics and Monitoring series covers scraping and alerting on exactly this kind of endpoint.
What you have, and the series so far
You can reload gunicorn under load without dropping a request, you have a health check that reports real signals, and your logs are structured JSON that journald can index. That is the full production shape.
Across the series you built a virtualenv and a Flask app, ran it under systemd, put it behind nginx on a unix socket, gave it environment secrets, sized its workers, and now reload it with zero downtime. That is a Python web app you can operate on a single VPS with confidence.