Add a health check, logs, and metrics
A production service tells you it is alive before a user does. This final chapter gives the app three ways to be seen from outside: a health check endpoint that reports the process is up and how it is doing, structured JSON logs that land in journald, and a metrics endpoint that exposes memory and event-loop numbers for a scraper to collect. All of it runs behind nginx on a live Ubuntu 24.04 server, and every output below is real.
- A health check endpoint returns a small JSON body a load balancer or monitor can poll to confirm the process is answering.
- Structured JSON logs from pino go to stdout, journald captures them, and each line is a machine-readable event.
- Process metrics like resident memory and event-loop delay reveal trouble that a plain up or down check misses.
- nginx proxies the health and metrics routes just like any other, so monitoring reaches them through the same front door.
The distinction that matters is between "the port is open" and "the app is healthy". A TCP check tells you a process is listening. A health check that runs real code and reports memory and event-loop delay tells you whether that process is actually keeping up. The second is what wakes you before users notice, and it costs one route.
A health check endpoint
The route returns a small object: a status, the process id, its uptime, resident memory, and the event-loop delay. The last one is Node-specific and worth measuring, because a blocked event loop is the classic Node stall.
const { monitorEventLoopDelay } = require('node:perf_hooks');
const loop = monitorEventLoopDelay();
loop.enable();

app.get('/health', (req, res) => {
  const m = process.memoryUsage();
  res.json({
    status: 'ok', pid: process.pid, uptimeSec: Math.round(process.uptime()),
    rssMb: +(m.rss / 1048576).toFixed(1),
    eventLoopP99Ms: +(loop.percentile(99) / 1e6).toFixed(2),
  });
});
Poll it and read the numbers back. A load balancer can hit this on an interval and pull an instance out of rotation the moment the status stops being ok.
curl http://127.0.0.1:3000/health
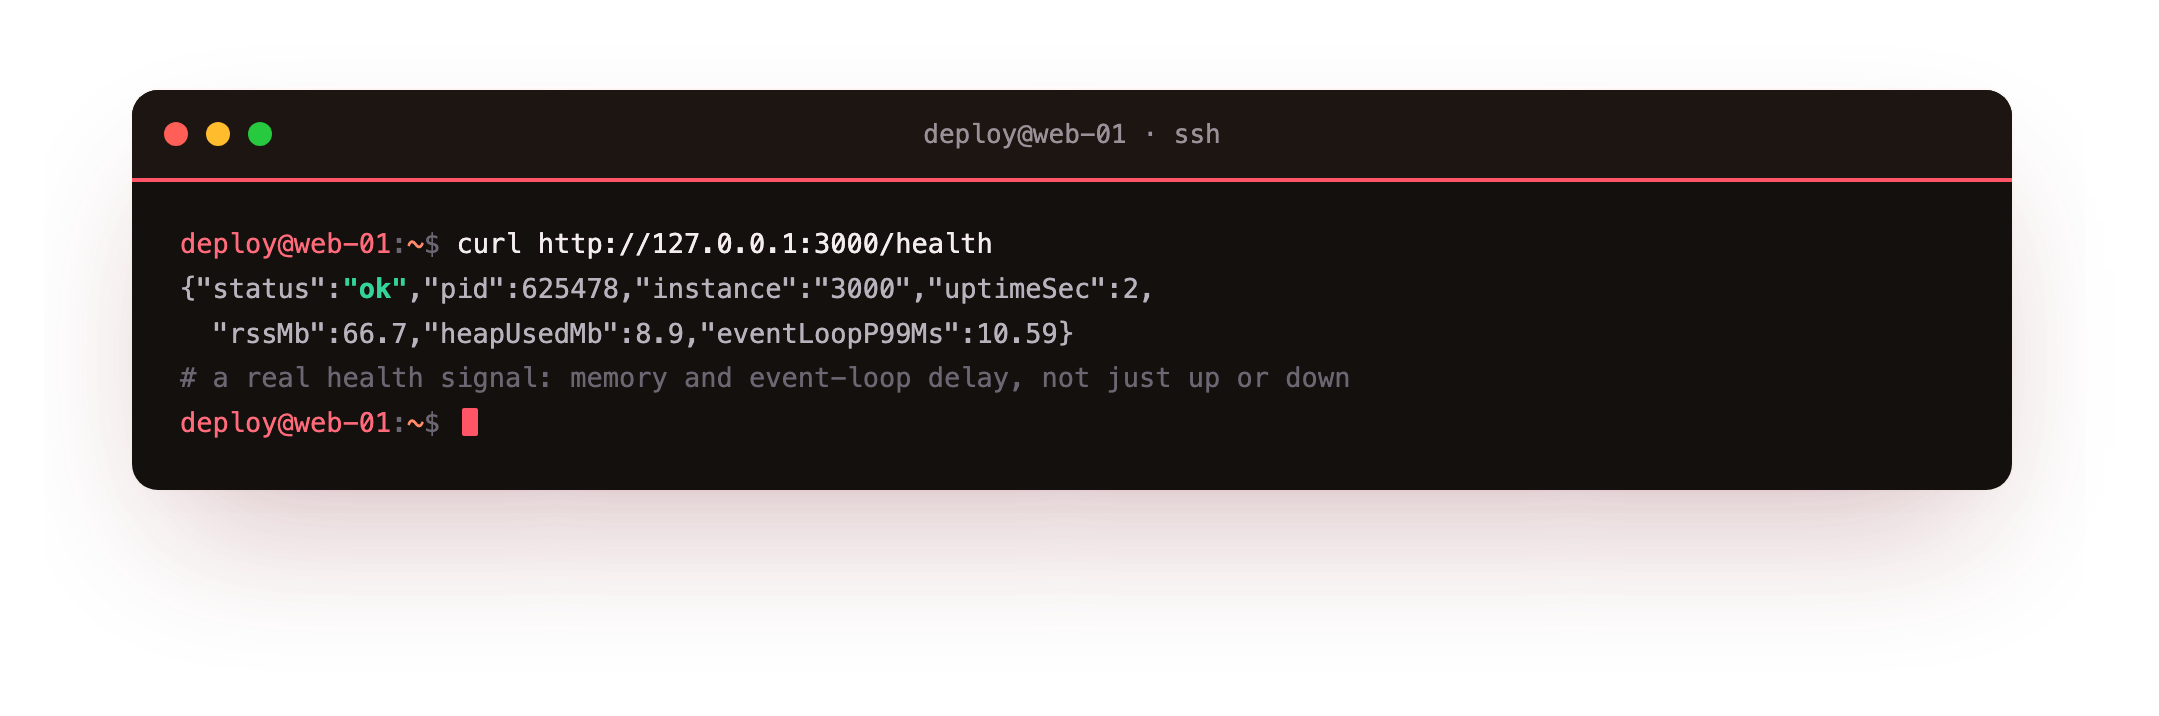
The response reports "status":"ok", the uptime in seconds, resident memory around 66.7 MB, and an event-loop 99th-percentile delay near 10 ms. That last figure is the health signal a port check cannot give you: if the loop delay climbs into the hundreds of milliseconds, the app is stalling even while the port stays open.
The health route should return "status":"ok" with a memory figure and an event-loop delay. This is the same response you saw in chapter one's destination shot, now reached through nginx, so a monitor can poll it and pull a stalling instance out of rotation before a user notices.
Structured logs to journald
Chapter two showed logs reaching journald. Now make each line structured. pino writes one JSON object per event to stdout, and systemd captures it, so you get machine-readable logs without a log file or a shipping agent.
const pino = require('pino');
const log = pino({ level: process.env.LOG_LEVEL || 'info', base: { app: 'shopapp' } });

log.info({ port: PORT, env: NODE_ENV }, 'shopapp listening'); // one JSON line to stdout
Because journald already holds the stream, you read and filter it with the same tools as any unit, and pipe a line through jq when you want it formatted.
journalctl -u shopapp -o cat -n 1 | jq .
curl -o /dev/null -w '%{http_code}\n' http://127.0.0.1:8090/health
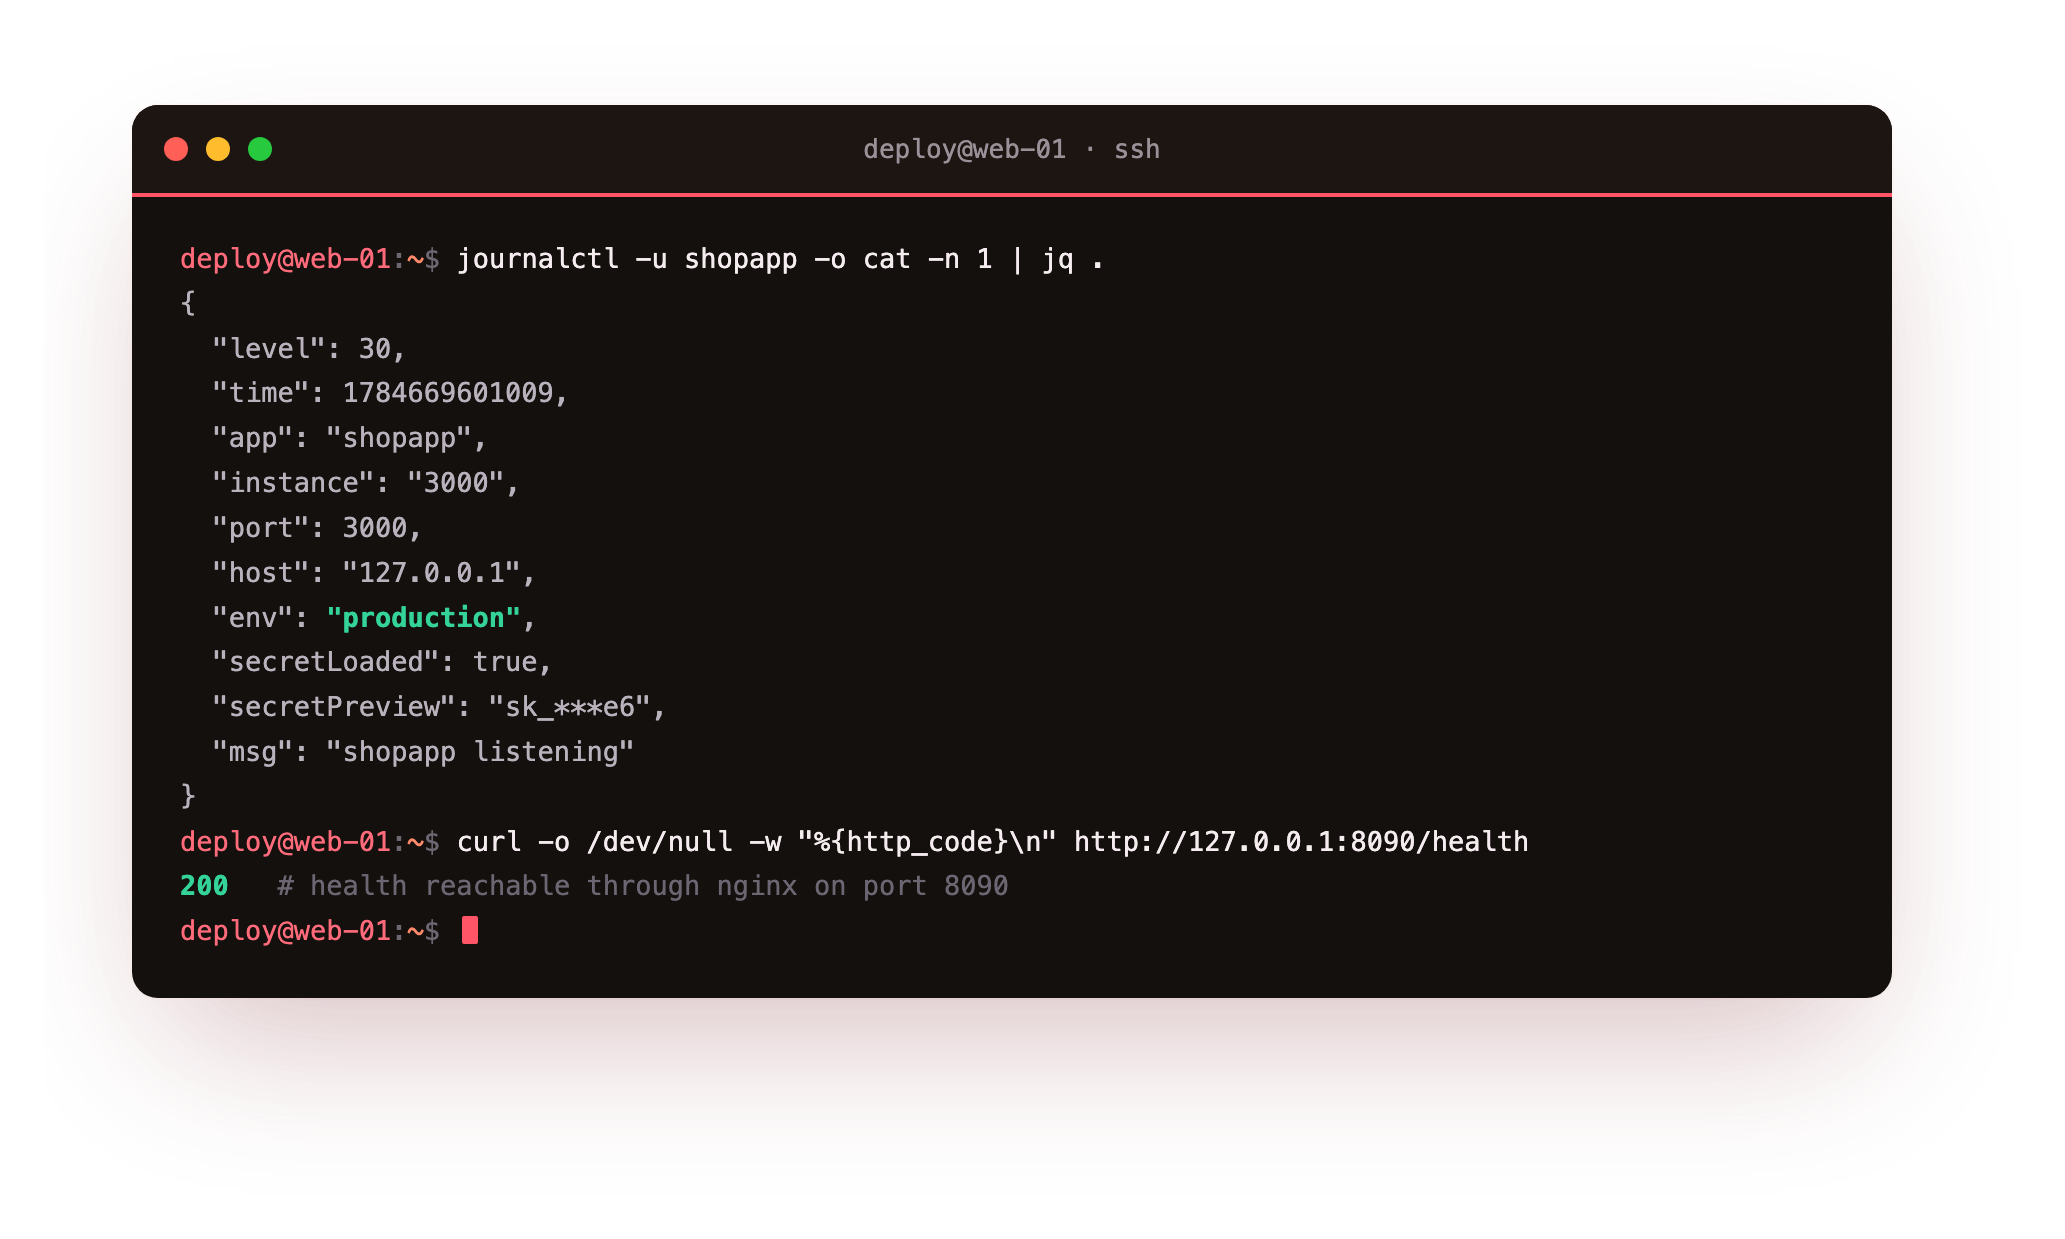
The log line is a JSON object with a level, a timestamp, the app name, and the message, which a log system can index by any field. The second command shows the health route answering 200 through nginx on port 8090, so monitoring reaches it the same way a browser reaches the app.
A metrics endpoint
A health check is a yes or no. Metrics are numbers over time, which is what you graph and alert on. Expose them in the text format Prometheus scrapes, built from the same process readings.
curl http://127.0.0.1:3000/metrics
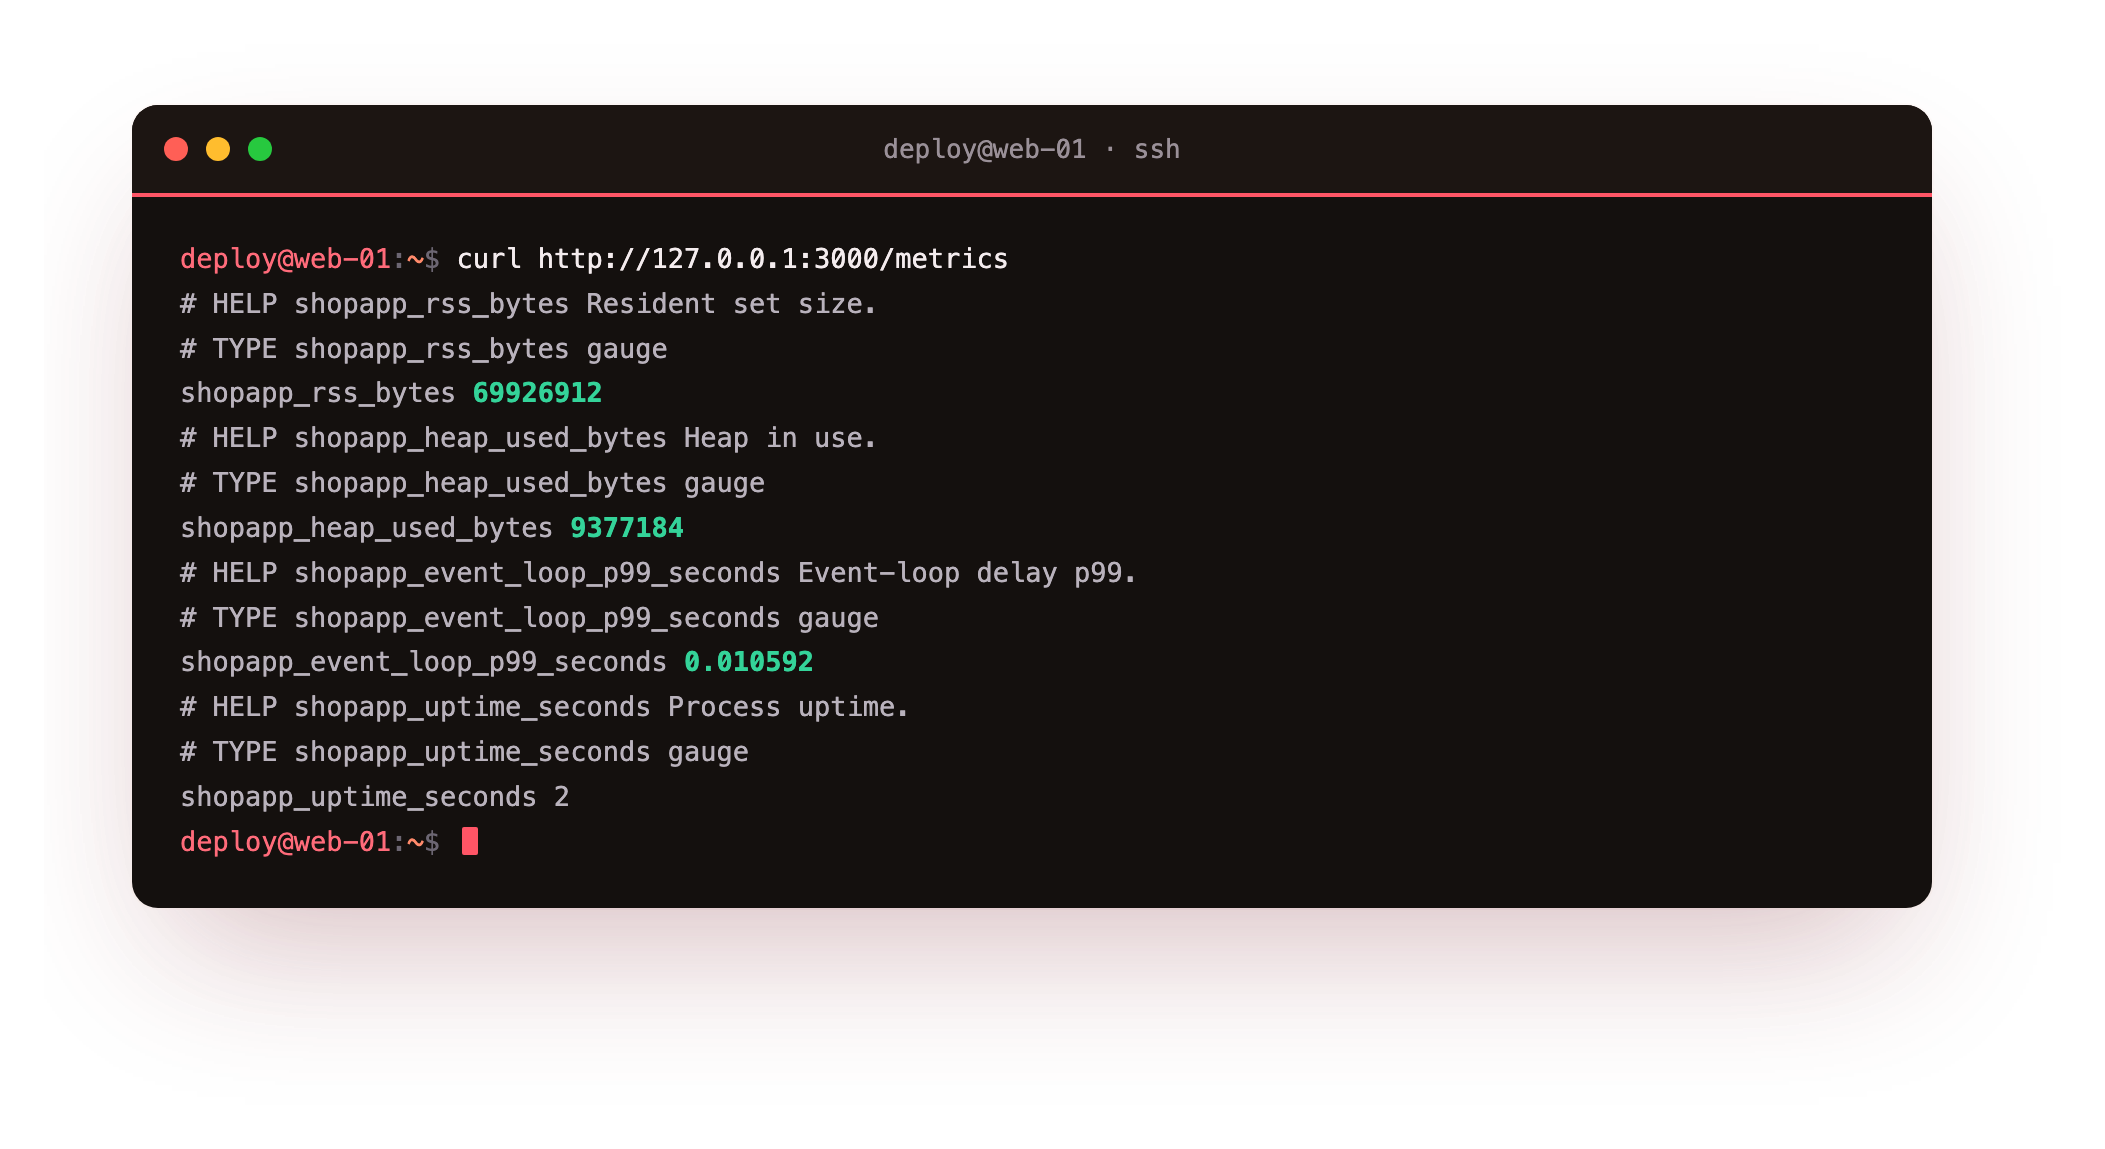
Each line is a named gauge with its current value: resident set size in bytes, heap in use, the event-loop 99th percentile in seconds, and uptime. A scraper reads this on an interval and stores the series, so you can see memory creeping up over a day or the event loop spiking under load, long before either becomes an outage.
What to actually watch
- Health status: the endpoint stops returning ok, or stops answering at all.
- Resident memory: a steady climb across a day points at a leak, so restart before it exhausts the box.
- Event-loop delay: a rising 99th percentile means the app is blocking, even while the port stays open.
These three cover most of what goes wrong with a Node service. The health check catches a dead or wedged process, memory catches a leak, and event-loop delay catches CPU-bound handlers choking the single thread. Wire them into whatever you already run, from a simple uptime poller to the Prometheus stack.
Frequently asked questions
What is the difference between a health check and a metrics endpoint?
A health check answers a single question, is the app healthy right now, with a small body a load balancer polls to decide whether to route traffic. A metrics endpoint exposes numbers over time that a scraper collects and graphs. You want both: the health check for fast in-or-out decisions, and metrics for trends and alerts that fire before a failure.
Should the health check touch the database?
Keep a liveness check cheap so it only reports whether the process itself is up, since making it query the database can take an instance out of rotation for a problem it cannot fix. A separate readiness check that verifies dependencies is useful for deploys, but keep the two apart so a slow database does not look like a dead app.
Why JSON logs instead of plain text?
Plain text is easy for a human reading one server and painful for a machine searching many. JSON logs give every line named fields, so a log system can filter by level, request id, or user without fragile parsing. pino writes them with very little overhead, and you can still pretty-print a line with jq when you are reading by eye.
Do I need Prometheus to use a metrics endpoint?
No. The endpoint is just text over HTTP, so anything that can fetch a URL can read it, including a small script on a timer. Prometheus is the common scraper because it stores the series and pairs with alerting and Grafana, but the endpoint does not depend on it. Start by exposing the numbers, then point whatever monitoring you have at them.
What you have, and where the series leaves you
The app now reports its own health, writes structured JSON logs into journald, and exposes memory and event-loop metrics for a scraper, all reachable through nginx. You can see inside the running service instead of guessing.
That closes the series. Across six chapters the app went from node server.js in a terminal to a supervised service on a bare slice: installed on a supported runtime, kept alive by systemd across reboots and crashes, served live through nginx, configured through the environment with secrets locked down, spread across every core, deployed with zero downtime, and reporting its own health. That is what running Node.js on a server actually takes, and it now stays up whether or not your laptop is on.