Diagnosing CPU saturation on Linux
CPU saturation on Linux happens when more tasks want to run than you have cores, so tasks queue and latency climbs. The previous chapter spotted it with the load average and the run queue. This chapter finds out which core is busy and which process is responsible, using mpstat for per-core utilisation, pidstat for per-process time, and perf for hardware counters. Every reading below comes from a live two-vCPU Ubuntu 24.04 server under a bounded stress-ng load.
mpstat -P ALLshows each core separately, so you can tell a single pinned core from a whole machine that is saturated.pidstatattributes CPU time to processes over an interval, which names the hot process without the noise of atoprefresh.perf statreads hardware counters and reports instructions per cycle, a truer picture of CPU work than a percentage.- On a virtualised guest,
perf topsampling can be blocked by the hypervisor, so know the fallback before an incident.
The load average tells you the machine is busy. It does not tell you whether one runaway thread is pinning a single core or a fleet of workers is filling both. That distinction changes the fix, and it is why per-core and per-process tools come next.
Per-core utilisation with mpstat
mpstat -P ALL prints one row per CPU plus an all summary. On the idle server every core sat above 90 percent idle. Under a two-worker stress-ng load that matches the core count, both cores changed together.
mpstat -P ALL 1
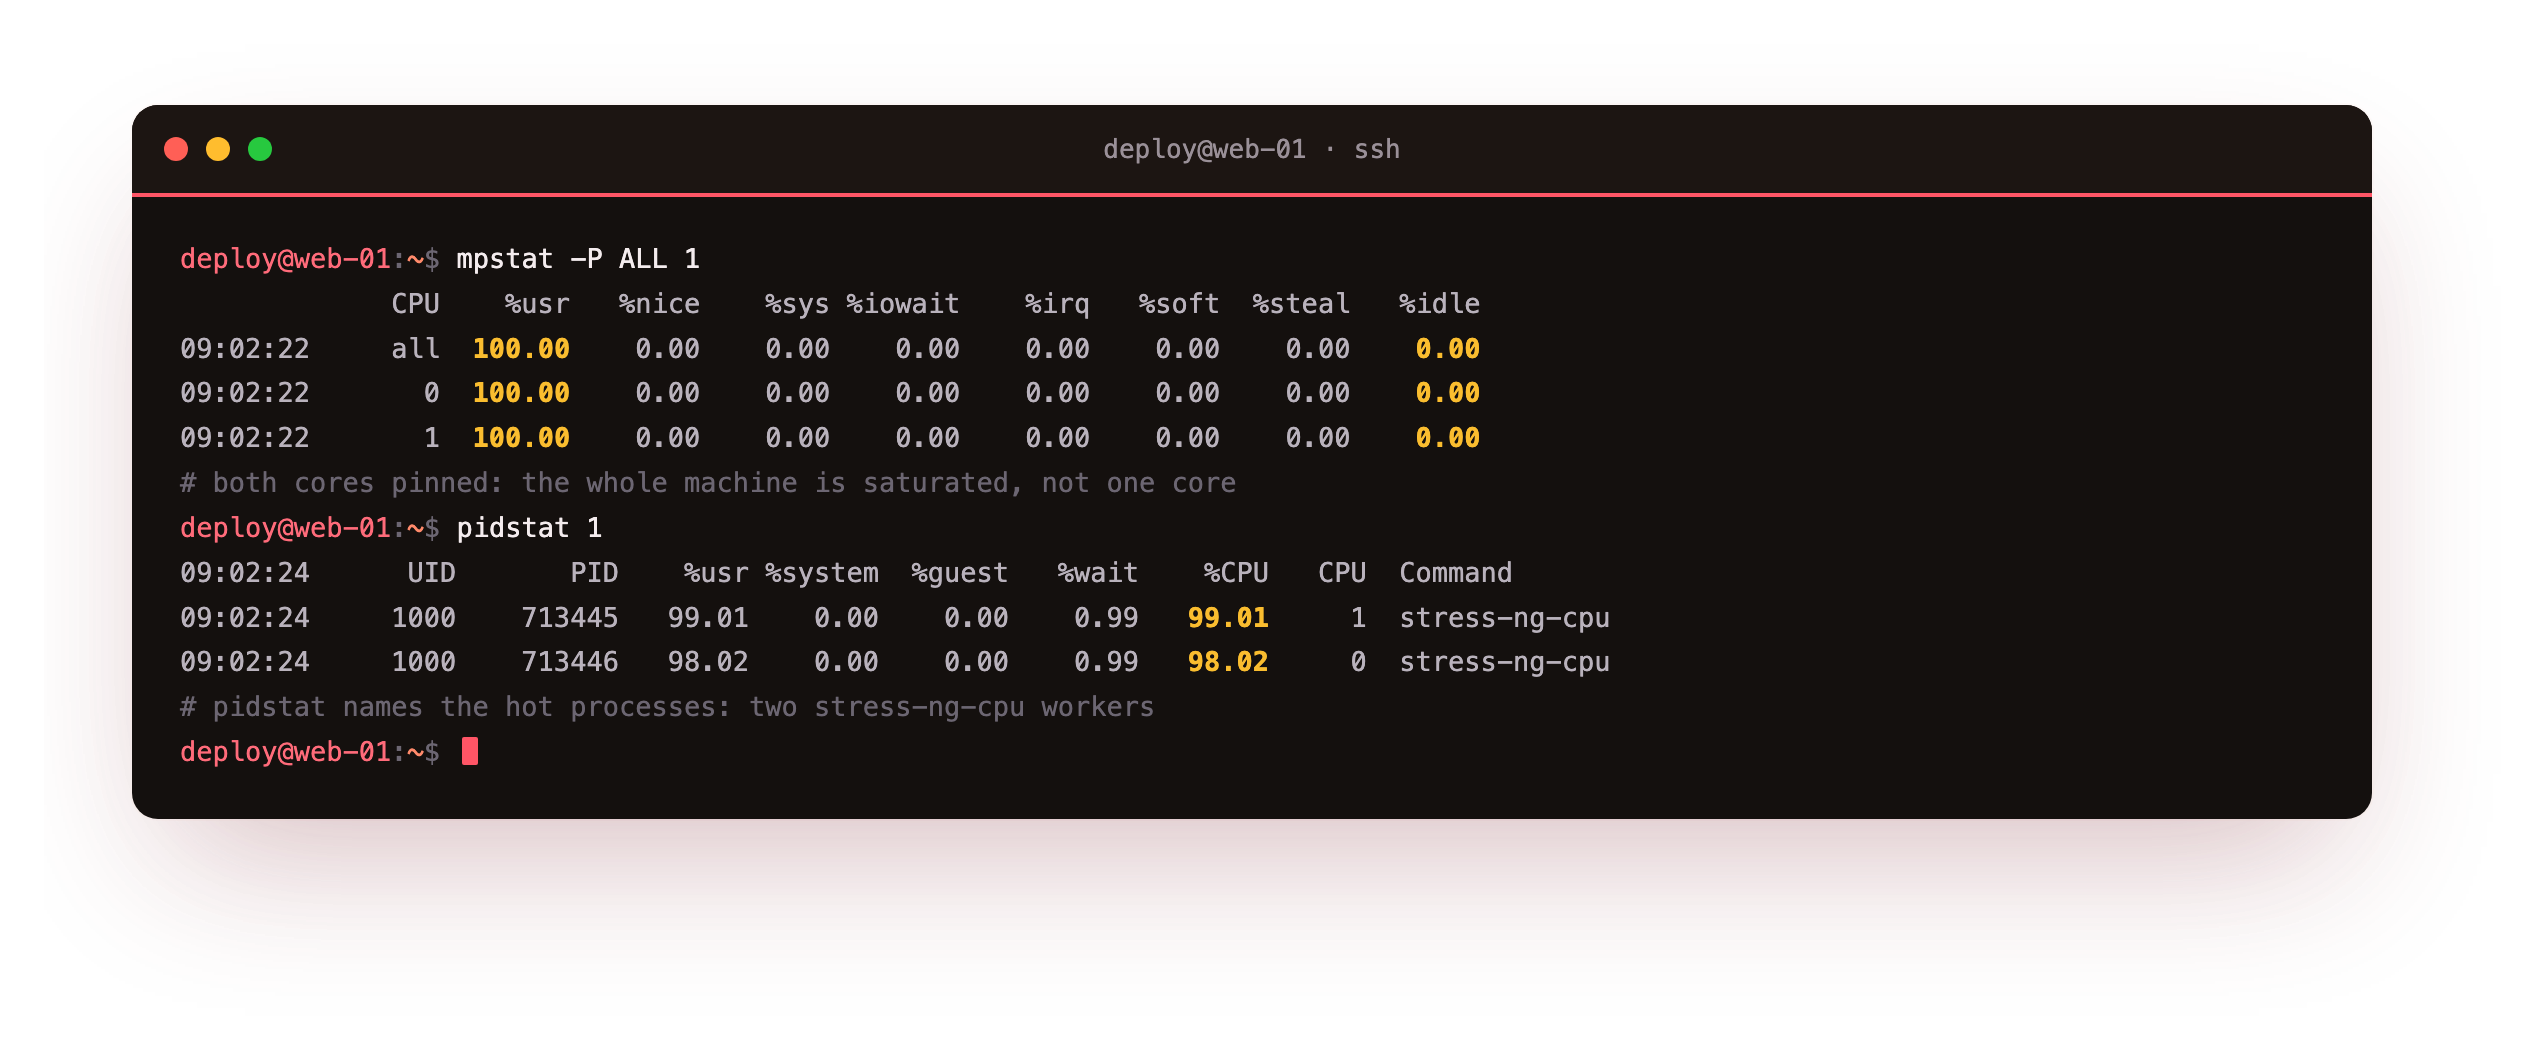
Each core reported 100.00 %usr and 0.00 %idle, and the all line averaged the same. Reading this as the USE method, utilisation is pinned across the whole machine, not one core. If instead you saw core 0 at 100 percent and core 1 near idle, you would be looking at a single-threaded process that cannot spread, and adding cores would not help it. The per-core split is the reason mpstat beats a single aggregate number.
Finding the hot process with pidstat
Knowing both cores are busy, the next question is which process is burning them. pidstat samples per-process CPU over an interval and prints the busiest.
pidstat 1
Under load it listed two stress-ng-cpu workers, PIDs 713445 and 713446, each holding around 98 percent CPU, with the %CPU column making the split between user and system time clear. Because pidstat measures over a fixed interval rather than an instant, its numbers are steadier than a glance at top, which makes it the tool to quote in an incident note. Once you have a PID and a command name, you can decide whether to renice it, throttle it, or fix the code.
Under your own stress-ng --cpu load, mpstat -P ALL 1 should show every core near 100.00 %usr, and pidstat 1 should name the workers with a steady high %CPU. That pair, all cores busy plus a named process, is the CPU case fully diagnosed. If one core is busy and the rest idle, you have a single-threaded process instead, which the next paragraph addresses.
What perf can measure, and what it cannot
A percentage tells you a core is busy. It does not tell you whether the work is efficient. perf stat reads the CPU's hardware counters and reports that directly. Running it around a short stress-ng workload worked cleanly on this guest.
sudo perf stat -e task-clock,cycles,instructions,branches,branch-misses -- stress-ng --cpu 2 --timeout 5s
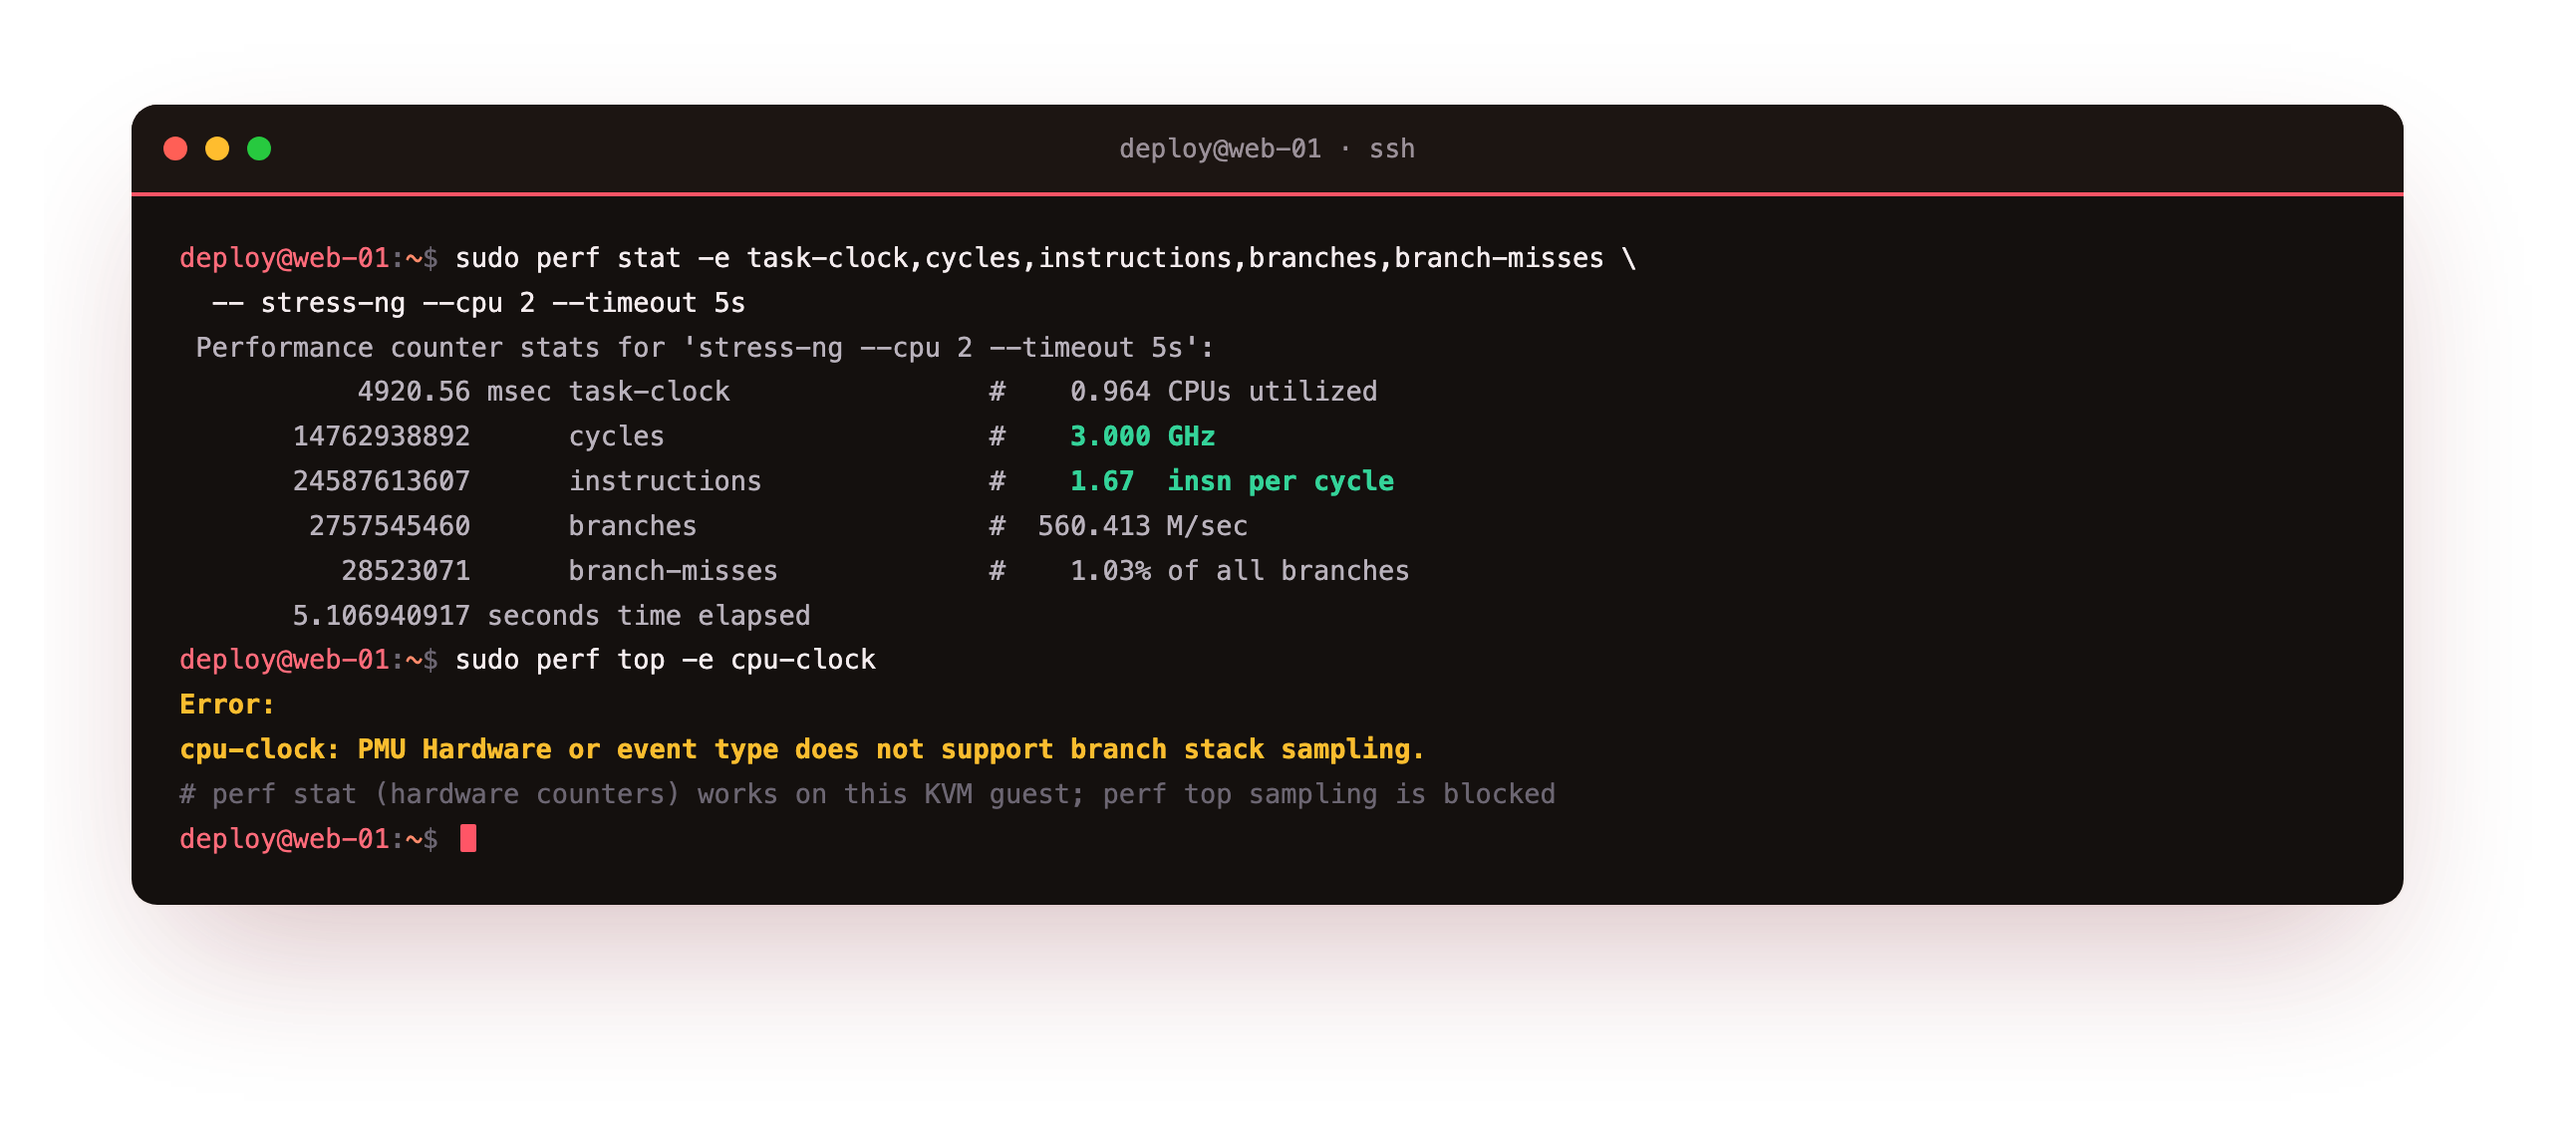
It reported 14762938892 cycles at 3.000 GHz, 24587613607 instructions, an insn per cycle of 1.67, and a branch miss rate of 1.03%. Instructions per cycle is the number to learn: a value near or above 1 means the CPU is doing useful work each tick, while a low IPC under high utilisation hints at memory stalls or cache misses rather than honest compute.
Sampling is a different story on a virtualised kernel. perf top, the live sampling profiler, failed here with PMU Hardware or event type doesn't support branch stack sampling, because the hypervisor does not expose the performance unit features it wants. This is common on cloud instances, so it is worth saying plainly rather than pretending the command worked. The honest fallback is pidstat for attribution and perf stat for efficiency, both of which do work.
Going further: a sampling profile on a guest
When perf top is blocked, system-wide recording with a software event often still succeeds, because a software event does not need the hardware sampling features the hypervisor withheld.
sudo perf record -a -F 99 -e cpu-clock -g -- sleep 5
Reading the result with perf report attributed 97.68% of samples to stress-ng-cpu, confirming the same culprit that pidstat named, this time with a call graph. The lesson for a guest is to reach for -e cpu-clock sampling rather than the default hardware event. If even that is denied, pidstat alone is enough to find a hot process, which is why this series leans on it.
Frequently asked questions
How do I tell a single hot thread from a fully saturated machine?
Run mpstat -P ALL. If one core reads 100 percent and the others are near idle, a single-threaded process is pinning that core, and more cores will not help until the code parallelises. If every core is busy, the whole machine is saturated and you either shed load or add capacity. The aggregate CPU percentage in a plain top header hides this, which is why the per-core view matters during triage.
Why does perf top fail on my cloud server?
Many virtualised guests do not expose the full hardware performance unit, so perf top fails when it asks for branch stack sampling. It is a hypervisor limit, not a broken install. Try perf record -a -e cpu-clock, which uses a software event and usually works, or fall back to pidstat for process attribution. On this Ubuntu 24.04 guest, perf stat with hardware counters worked while perf top did not, so test both on your own box.
What is a good instructions-per-cycle number?
Instructions per cycle, or IPC, above 1 generally means the CPU is retiring useful work each tick. A low IPC while utilisation is high suggests the CPU is stalling on memory or missing cache rather than computing, which points you at data layout instead of raw core count. There is no single target, since it depends on the workload, but comparing IPC before and after a change tells you whether the change helped the CPU do more per cycle.
Does pidstat need root?
For your own processes, no. To read CPU and IO figures for processes owned by other users, run it under sudo so it can see the full process table. The interval argument, as in pidstat 1, sets how often it samples; without it you get a single average since boot, which is rarely what you want during an incident. Add -u for CPU or -d for disk to narrow the columns.
What you have, and what comes next
You can now separate a pinned core from a saturated machine with mpstat -P ALL, name the hot process with pidstat, and read CPU efficiency with perf stat. You also saw an honest limit: on this virtualised kernel perf top was blocked, and the working path was a cpu-clock recording or plain pidstat. Those two habits, per-core first and per-process second, resolve most CPU incidents quickly.
The next chapter moves to memory. It reads free -h and /proc/meminfo correctly, explains swap and swappiness, measures per-process memory, and triggers a real out-of-memory kill inside a bounded cgroup so you can read the kernel's own record of it.