Reading Linux memory usage without the myths
When CPU is not the bottleneck, memory is usually the next suspect, and reading Linux memory usage trips people up because a healthy server looks almost full. The kernel spends free RAM on the page cache to speed up disk reads, and hands it back the moment a program needs it, so the number that matters is not "used" but "available".
This chapter reads free -h and /proc/meminfo the right way on a live Ubuntu 24.04 server with about two gigabytes of RAM, covers swap and swappiness, measures per-process memory, and triggers a real out-of-memory kill inside a bounded cgroup.
- The
availablecolumn infree -his the honest figure: memory a new program can get, including reclaimable cache. - Cache under
buff/cacheis not wasted. The kernel reclaims it on demand, so high cache with high available is a healthy state. - Read per-process memory as RSS with
ps, and as PSS withsmemwhen processes share pages. - When a cgroup exceeds its limit, the kernel OOM killer picks a process and records the kill in the kernel log, which you read with
journalctl -k.
Get the reading right first, because most "out of memory" panics are really a misread of the used column. Then we will cause a controlled kill so you recognise the real thing in the logs.
What free -h is really telling you
free -h prints memory in human units. The trap is the used column, which people read as danger.
free -h
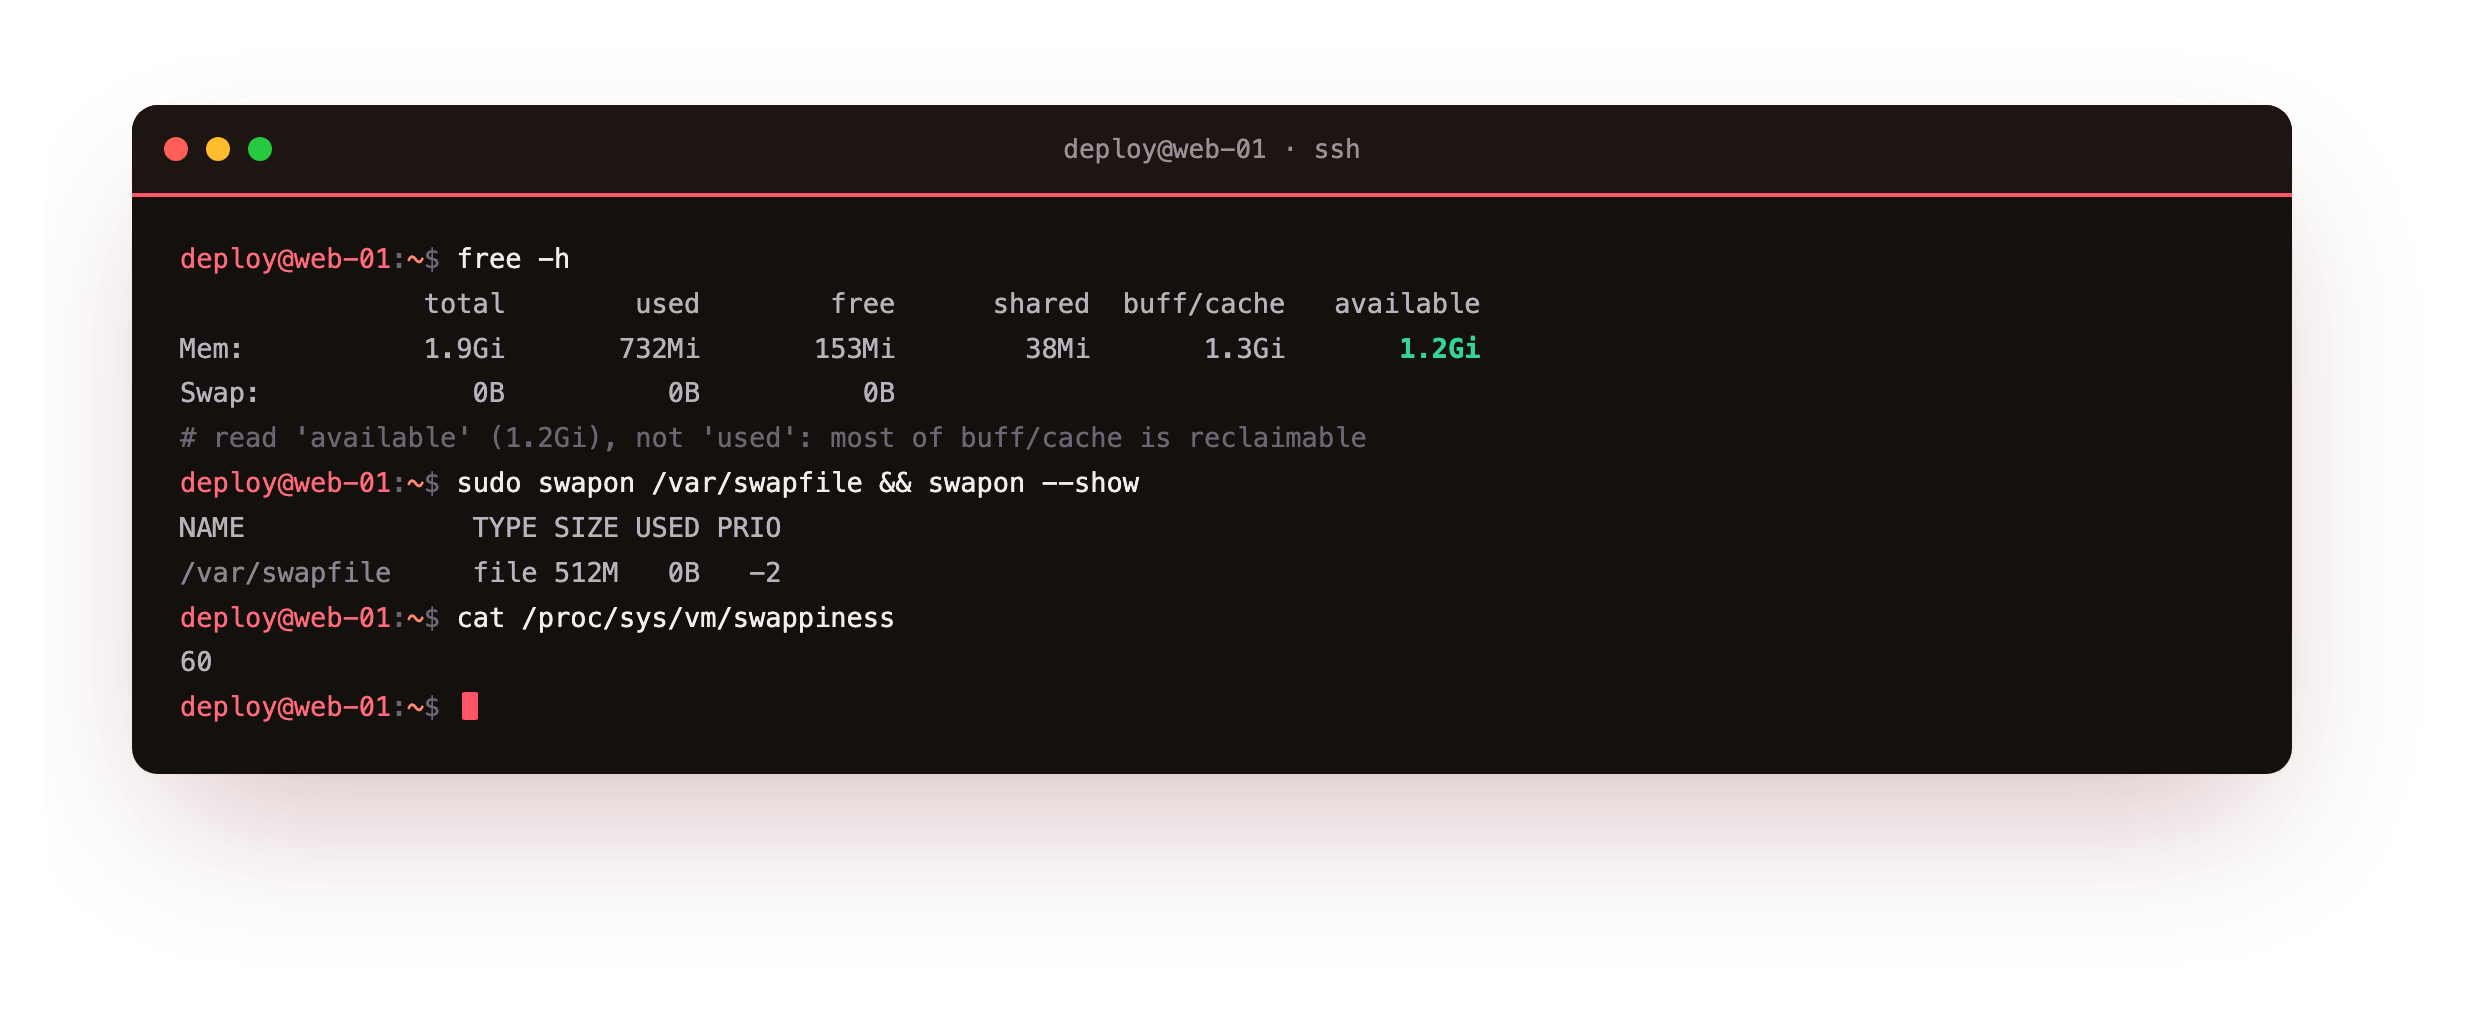
On this server it showed 1.9Gi total, 732Mi used, 1.3Gi buff/cache, and 1.2Gi available. Read the last number, not the second. The available figure of 1.2Gi is what a new process can obtain, because most of that buff/cache is reclaimable. The used value alone would suggest the box is a third full, which is true but not the constraint. /proc/meminfo carries the same story with more fields.
grep -E "MemTotal|MemAvailable|Buffers|Cached|SwapTotal|Dirty" /proc/meminfo
Here MemAvailable read 1264684 kB against a MemTotal of 2014856 kB, with Cached at 1142376 kB. The Dirty line, 468 kB, is memory written but not yet flushed to disk, which ties memory pressure to the IO chapter.
On your box, free -h should show a large buff/cache and an available figure well above free. Read available, not used. If available is small and Swap is filling, that is real memory pressure and the OOM section below shows what happens next. If available is healthy, a nearly full used column is the cache doing its job.
Swap and swappiness
This server started with no swap, which free showed as Swap: 0B. Swap is disk used as overflow for anonymous memory. It does not make a box faster, but it gives the kernel somewhere to place cold pages before it has to kill something. Adding a small swap file is a bounded, reversible change.
sudo fallocate -l 512M /var/swapfile
sudo chmod 600 /var/swapfile
sudo mkswap /var/swapfile
sudo swapon /var/swapfile
After that, swapon --show listed the 512M file and free -h reported Swap: 511Mi. The vm.swappiness value, 60 by default here, controls how eagerly the kernel moves cold anonymous pages to swap versus dropping cache. On a memory-tight application server, a lower value such as 10 keeps more of the app in RAM. Read it with cat /proc/sys/vm/swappiness before you tune it.
Per-process memory: RSS and PSS
To find what is using memory, sort processes by resident set size. RSS is the physical RAM a process holds right now.
ps -eo pid,rss,vsz,comm --sort=-rss | head -8
The top entries here were real services: minio at about 147 MB RSS, dockerd at 61 MB, and prometheus at 46 MB. RSS double counts shared pages, though, so several processes that map the same library each show the full amount. When that matters, smem reports PSS, which splits shared pages fairly, and USS, the memory that would be freed if the process exited.
sudo smem -c "pid user command rss pss uss" -r
For minio the PSS was close to its RSS, meaning little of its memory is shared, while dockerd showed a PSS below its RSS because it shares pages. PSS is the figure to sum when you want a true total across many processes.
Watching a real OOM kill
When memory runs out, the kernel's OOM killer chooses a process and terminates it. Rather than risk the whole server, you can confine the pressure to a cgroup with a hard limit, so only that scope dies. This keeps nginx, Docker and the rest of the box safe while you produce a genuine kill.
sudo systemd-run --scope -p MemoryMax=150M -p MemorySwapMax=0 stress-ng --vm 1 --vm-bytes 400M --vm-keep --timeout 15s
The scope tried to touch 400 MB inside a 150 MB cap, and the kernel killed it. Reading the kernel log showed the exact record.
sudo journalctl -k --since "2 min ago" | grep -iE "out of memory|killed process"
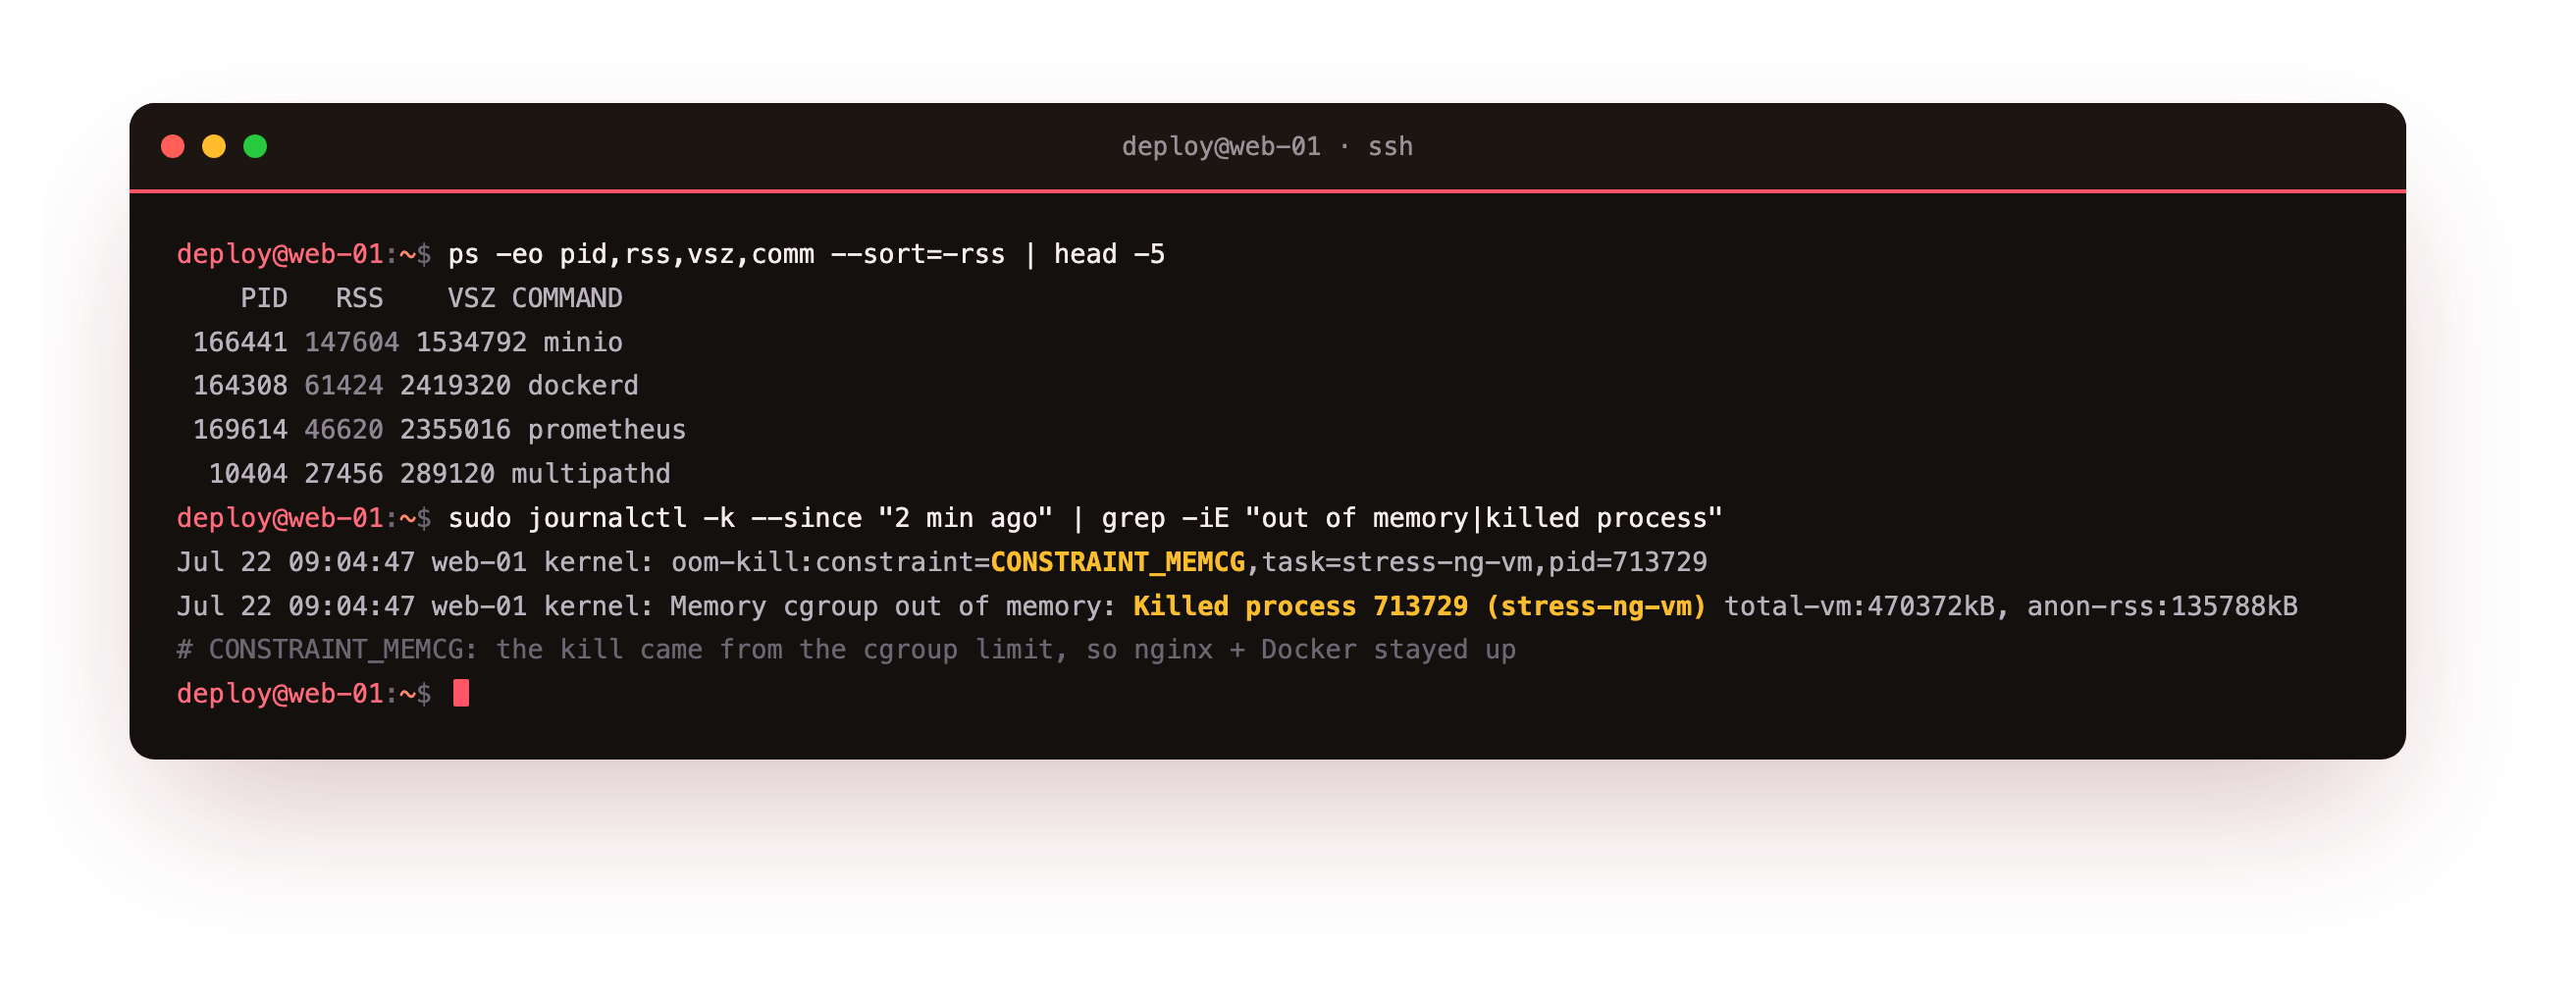
The line read Memory cgroup out of memory: Killed process 713729 (stress-ng-vm), with the constraint marked CONSTRAINT_MEMCG. That word is the tell: the kill came from a cgroup limit, not from the whole machine running dry. After it, nginx was still active and the containers were still up, because the limit contained the damage. A production OOM without a cgroup limit reads almost the same, minus the memcg constraint, which is how you tell a container kill from a host kill.
Frequently asked questions
My server shows almost no free memory. Should I worry?
Usually not. Linux uses spare RAM for the page cache, so free low and available healthy is the normal, efficient state. Look at the available column, which counts reclaimable cache. Only when available is small and swap is filling should you treat it as pressure. The kernel drops cache automatically when a program needs RAM, so a full buff/cache is the cache doing its job, not a leak.
Does adding swap slow my server down?
Swap itself does not slow a server. Actively swapping under memory pressure does, because disk is far slower than RAM. A small swap file gives the kernel room to park cold pages and can prevent an abrupt OOM kill, which is often better than the alternative. Watch the si and so columns in vmstat. Steady non-zero values mean the box is thrashing and needs more RAM or less load, not more swap.
What is the difference between RSS and PSS?
RSS is the physical memory a process holds, counting shared pages in full for every process that maps them, so summing RSS across processes overcounts. PSS divides each shared page among the processes sharing it, so summing PSS gives a truthful total. USS is the memory unique to a process, freed if it exits. Use RSS from ps for a quick look and PSS from smem when many processes share libraries.
How do I know if the OOM killer ran?
Read the kernel log with journalctl -k or dmesg and search for killed process. The kernel records the PID, the process name, and whether the kill came from a cgroup limit, shown as CONSTRAINT_MEMCG, or from the whole machine. If a service keeps restarting for no clear reason, an OOM kill is a common cause, and the log line names the victim so you can raise its limit or cut its memory use.
What you have, and what comes next
You can now read free -h by the available column instead of panicking at used, explain why buff/cache is healthy, add and reason about swap, and separate RSS from PSS when you hunt a memory hog. You also produced a real OOM kill inside a bounded cgroup and read the kernel's own record of it, without putting the host at risk.
The next chapter turns to disk. It reads iostat -xz for utilisation and latency, finds the process behind the IO with iotop and pidstat, and uses bounded dd and fio workloads to make the numbers real.