What you will have at the end
A server that is merely slow is the worst kind of incident: everyone feels it, no dashboard names it, and you are left poking at commands hoping one of them confesses. This series replaces the poking with the USE method, a fixed way to read a Linux server that pins the slowness on the CPU, memory, disk, or network using numbers you measured rather than a hunch.
By the end you can walk up to a box that "feels slow" and, in under a minute, say which resource is the constraint and which process is behind it. You will drive that on a live Ubuntu 24.04 slice with a small toolkit you install from scratch, put the box under a bounded synthetic load so the readings are real, and finish with a sixty-second triage you can run from memory during an incident.
This first chapter is for a developer or admin who has no method for slowness yet. It shows you the destination on a live server, installs the toolkit from a bare slice, then teaches the USE lens and the two commands, top and vmstat, that every later chapter builds on.
- The series destination: a vague "the server is slow" becomes a named resource and a named process, read from real numbers in about a minute.
- You start from a bare slice. The from-zero step is one install,
apt install sysstat stress-ng iotop fio, which gives you the whole toolkit the series uses. - The USE method checks Utilization, Saturation and Errors for each resource, so triage follows a checklist rather than a guess.
- Load average counts running plus waiting tasks, so you read it against the core count. A load of 2.79 on two cores means work is queued: CPU saturation.
- One Ubuntu 24.04 slice you can SSH into as a sudo user, ideally one you are free to drive to 100 percent for a minute or two without paging a team, since this chapter loads it on purpose.
- Two cores is plenty. The numbers below come from a two-vCPU slice, and a small box actually makes saturation easier to see because it takes less load to fill.
- No web service, database, or public port is needed. Every reading here is local, and the only traffic the box generates is the bounded load you start yourself.
- Enough shell to read a
topheader and start a command that runs for a set number of seconds, which is the entire skill floor for the series.
See the destination first
Here is where the whole series lands, on one screen, before any theory. Support says the app "feels slow" and there is nothing in the graphs. Instead of guessing, run two commands: uptime to see whether anything is queued, and top to see what is on the CPU.
uptime
top -bn1 | head -12
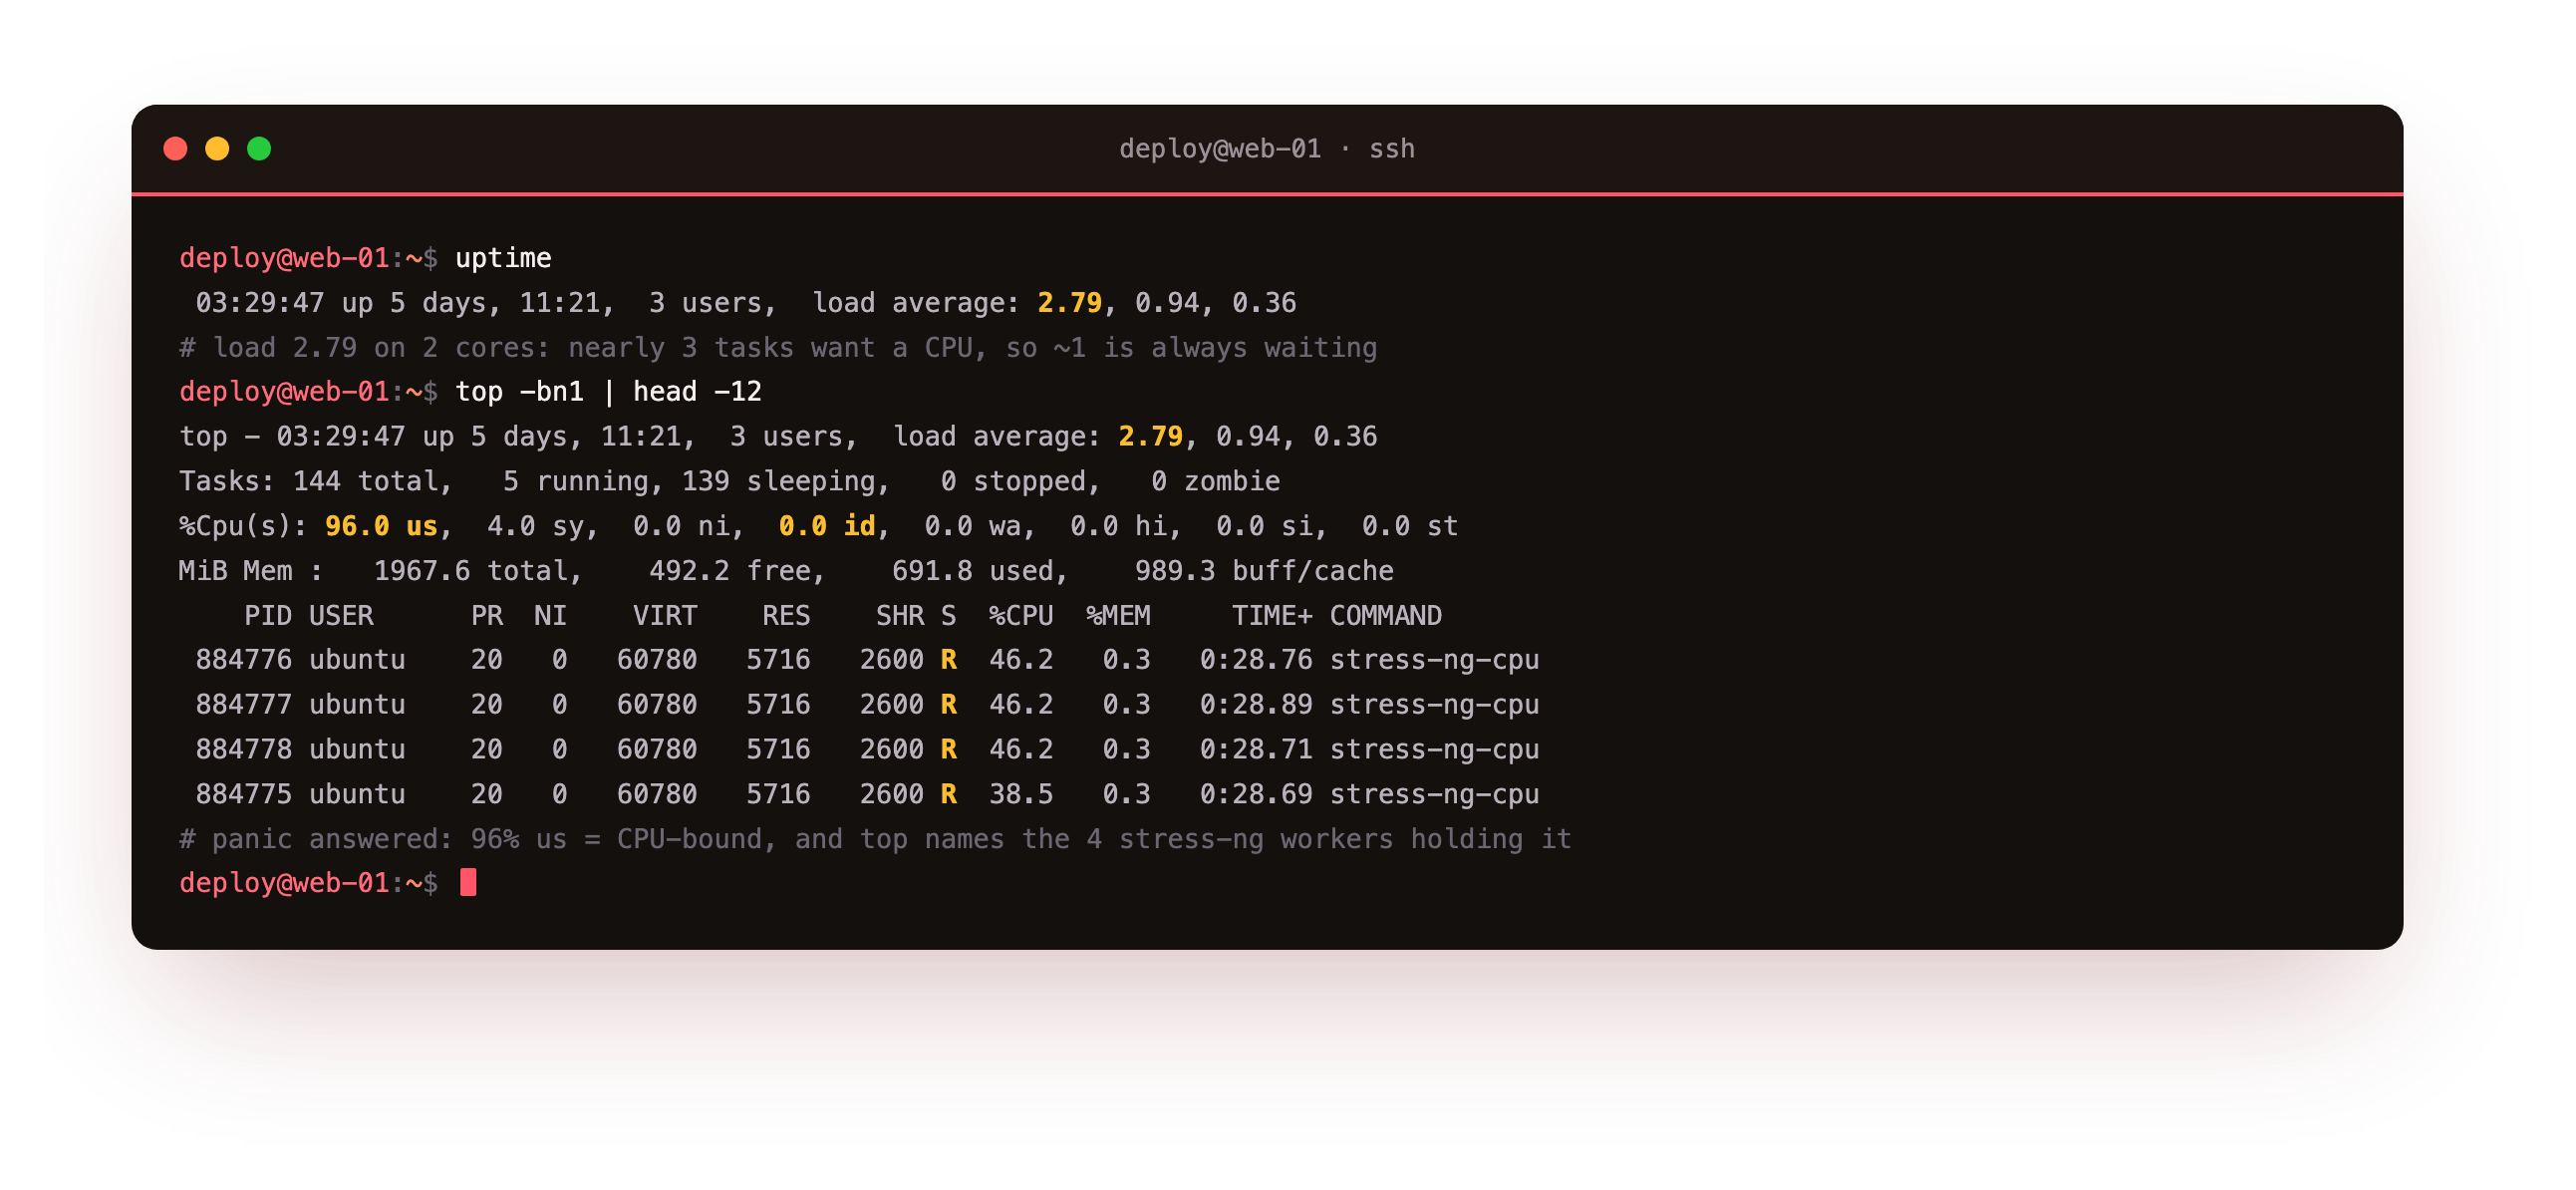
uptime reported load average: 2.79, 0.94, 0.36. On a two-core box a one-minute load of 2.79 means nearly three tasks want a CPU at every moment while only two exist, so roughly one is always waiting. top then names the cause: the %Cpu(s) header read 96.0 us, 0.0 id, almost all of it user code, and four stress-ng-cpu workers sat at the top of the process list holding the cores. That is the panic answered: the box is CPU-bound, and here are the four processes doing it.
Right now you cannot do this on your own box, because the tools are not all installed and the method is not yet a habit. The rest of this chapter fixes both, starting with the install.
Install the performance toolkit
On a fresh slice, a few of these tools are missing. top, uptime, and vmstat ship with the system, but the per-process and per-device tools do not. One install brings in the whole kit the series uses.
sudo apt update && sudo apt install -y sysstat stress-ng iotop fio
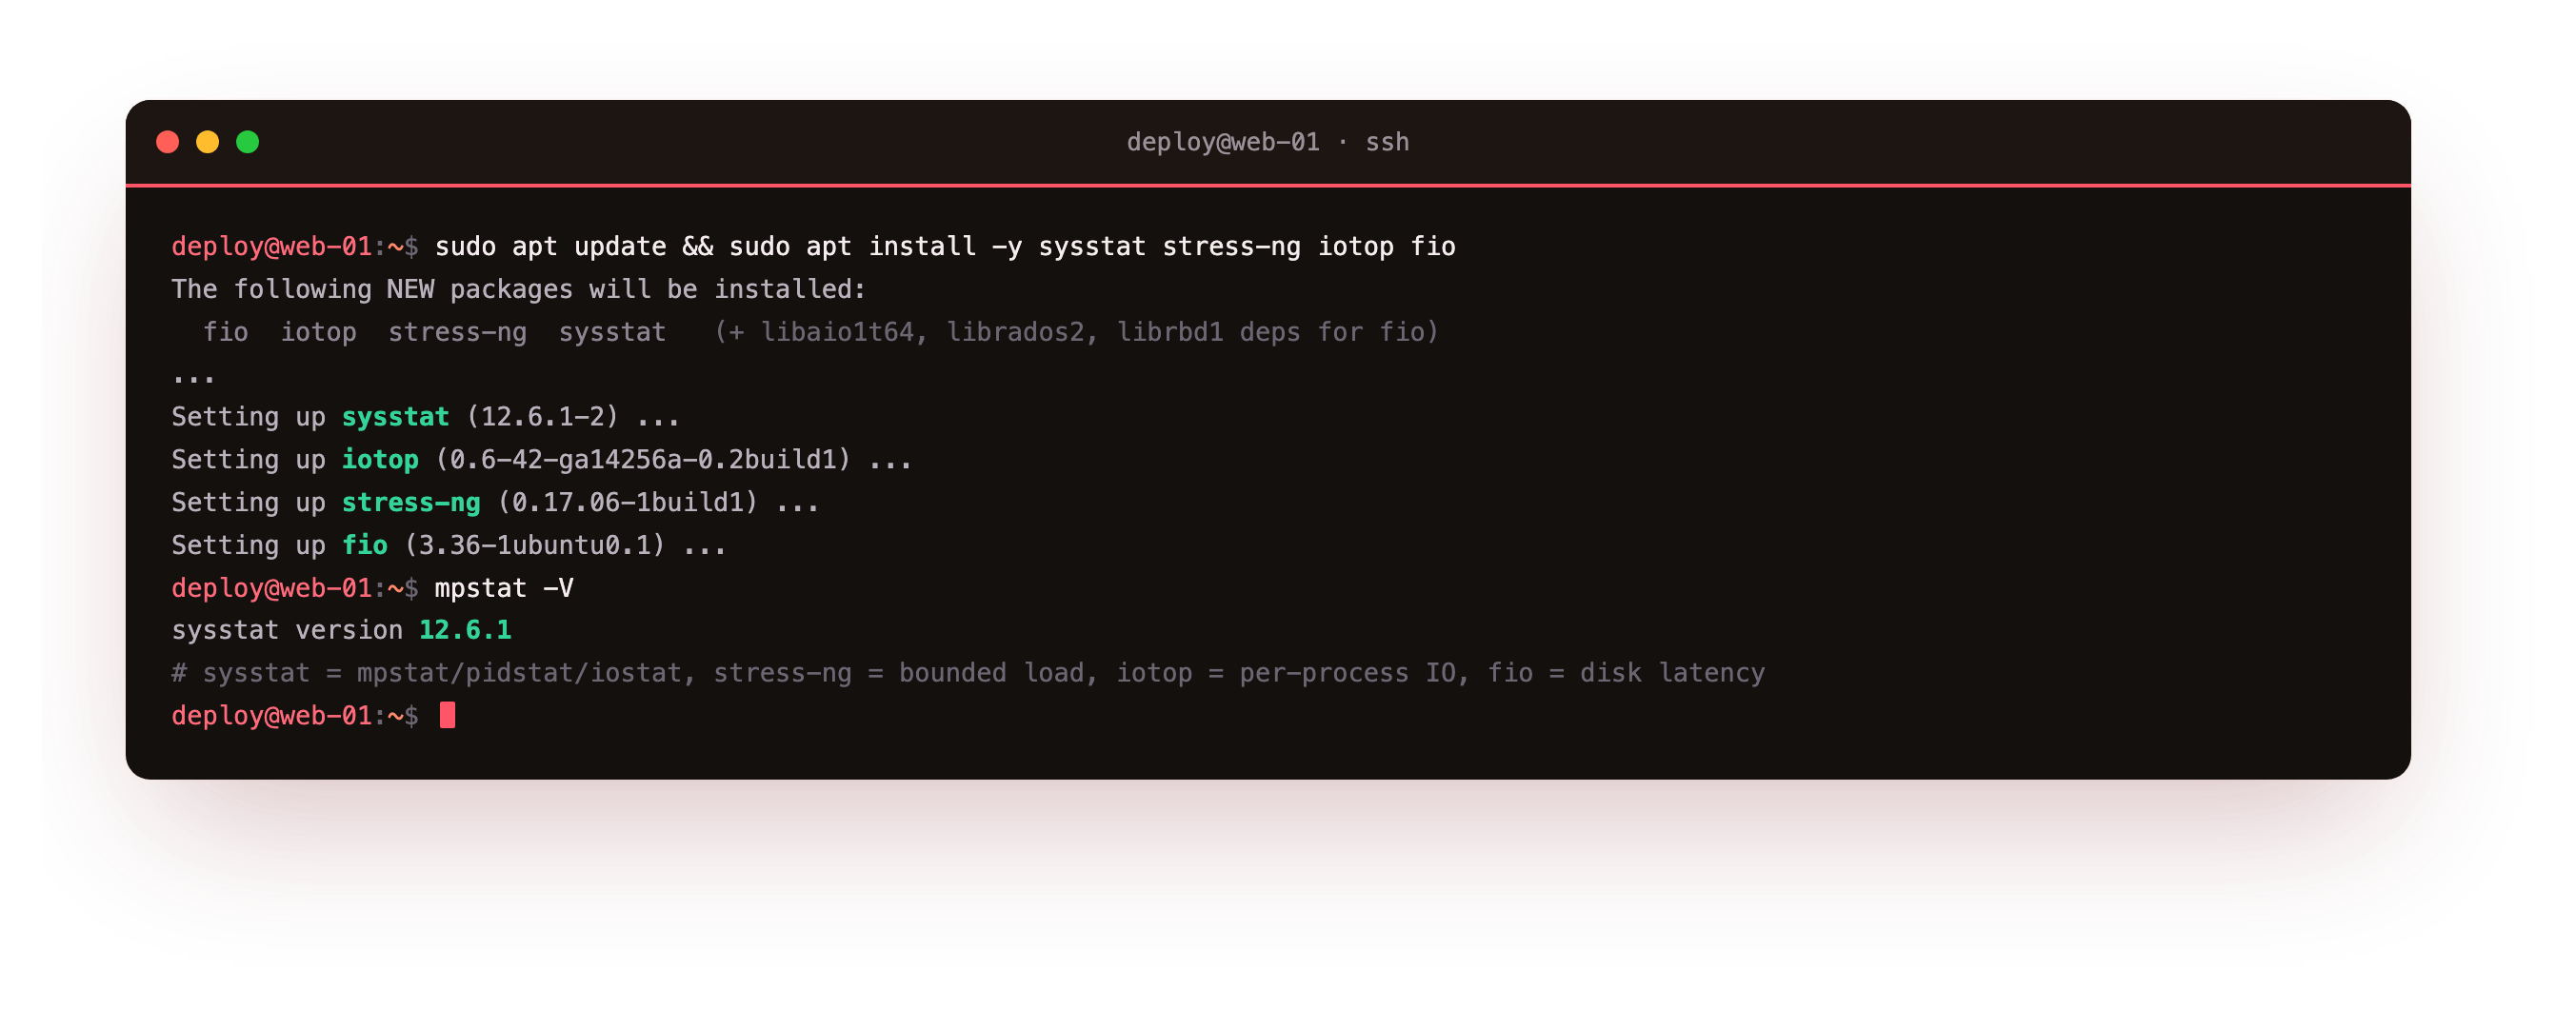
Each package earns its place. sysstat is the core: it provides mpstat for per-core CPU, pidstat for per-process time, and iostat for per-device disk, the tools that turn "busy" into "which core" and "which process". stress-ng generates the bounded synthetic load that makes every reading in this series real instead of hypothetical. iotop shows disk IO per process, and fio measures disk latency and throughput properly. Confirm the core installed with its version.
mpstat -V
Run mpstat -V and confirm it prints a sysstat version line, then stress-ng --version and confirm a version too. If both answer, the toolkit is in place and every later command in the series will run. If mpstat is not found, the sysstat package did not install, so rerun the apt install line and watch for an error.
The USE method, three questions per resource
Now the lens behind that quick read. For each resource you ask three things. Utilization is how busy it is, such as 96 percent CPU. Saturation is how much work is queued because the resource cannot keep up, which for CPU is the run queue or the load average above the core count. Errors are the failures it reports, which come from logs and dmesg.
The trick most people miss is that utilization near 100 percent is not automatically a problem, and a low number is not automatically healthy. Saturation is the reading that predicts rising latency, so it is the one to watch.
Keep the three letters in mind as we read each tool below. The same lens applies unchanged to memory, disk, and network in the chapters that follow, which is what makes it a method and not a bag of commands.
What the load average actually means
Start with uptime, the command from the destination read. It prints three load averages over the last one, five, and fifteen minutes. Load is the average number of tasks running or waiting for a CPU, so it only means something next to the core count.
nproc
nproc reported 2. Against that, the idle box earlier showed a load near 0.00, and the loaded box showed 2.79: fewer than two is comfortable, well above two means tasks are queuing, which is CPU saturation. Read the three numbers as a trend too. A one-minute value far above the fifteen-minute value means load is climbing; the reverse means it is easing.
Reading top: us, sy, wa and id
top shows utilisation and the busiest processes in one view. The header line that matters is %Cpu(s), which splits the last interval into categories. On an idle box it is mostly id, idle. To read it under pressure, put the box under a known load with four CPU workers on two cores, which oversubscribes it on purpose.
stress-ng --cpu 4 --timeout 100s
top -bn1 | head -5
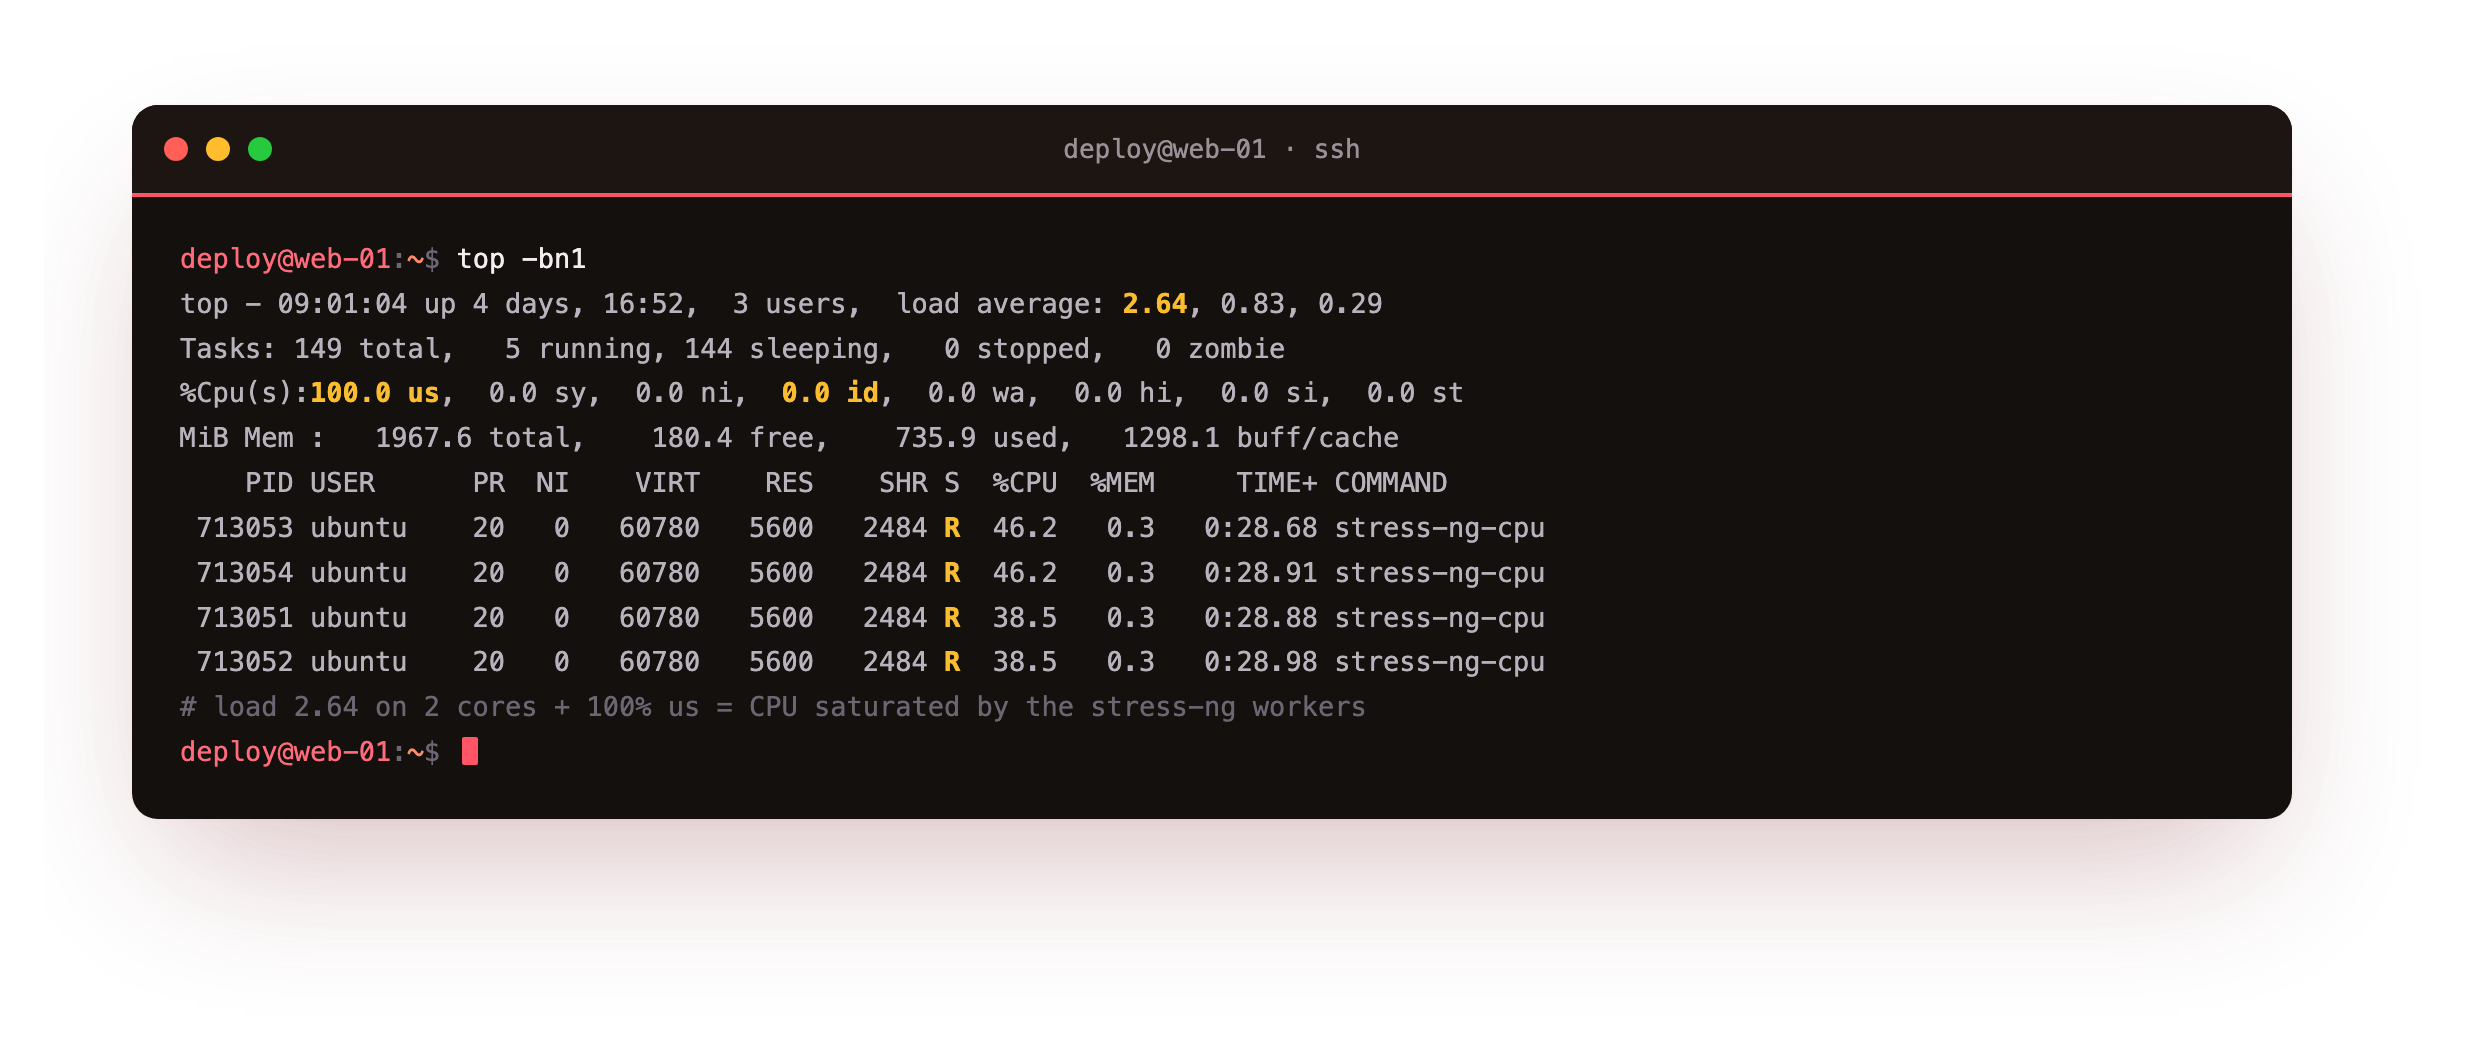
While the load ran, the %Cpu(s) header showed 100.0 us, 0.0 id and the load climbed past two. Read that with the USE lens: utilisation is pinned at user time, and the load above the core count is the saturation signal. The us field being high, rather than sy or wa, tells you the pressure is application code, not the kernel and not disk. The process list underneath then names the workers holding the cores, each in the R running state, which is where a real incident tells you what program to look at next.
During the stress-ng run, your top header should read close to 100 us with id near zero, and the load average should climb above your core count within a minute. If us stays low but wa rises instead, the load is landing on disk, not CPU, which is the signature the disk chapter reads.
vmstat: saturation in one column
top is busy and interactive. vmstat prints one compact line per interval, which is better for watching a trend or scripting a check. Run it with a one-second interval.
vmstat 1
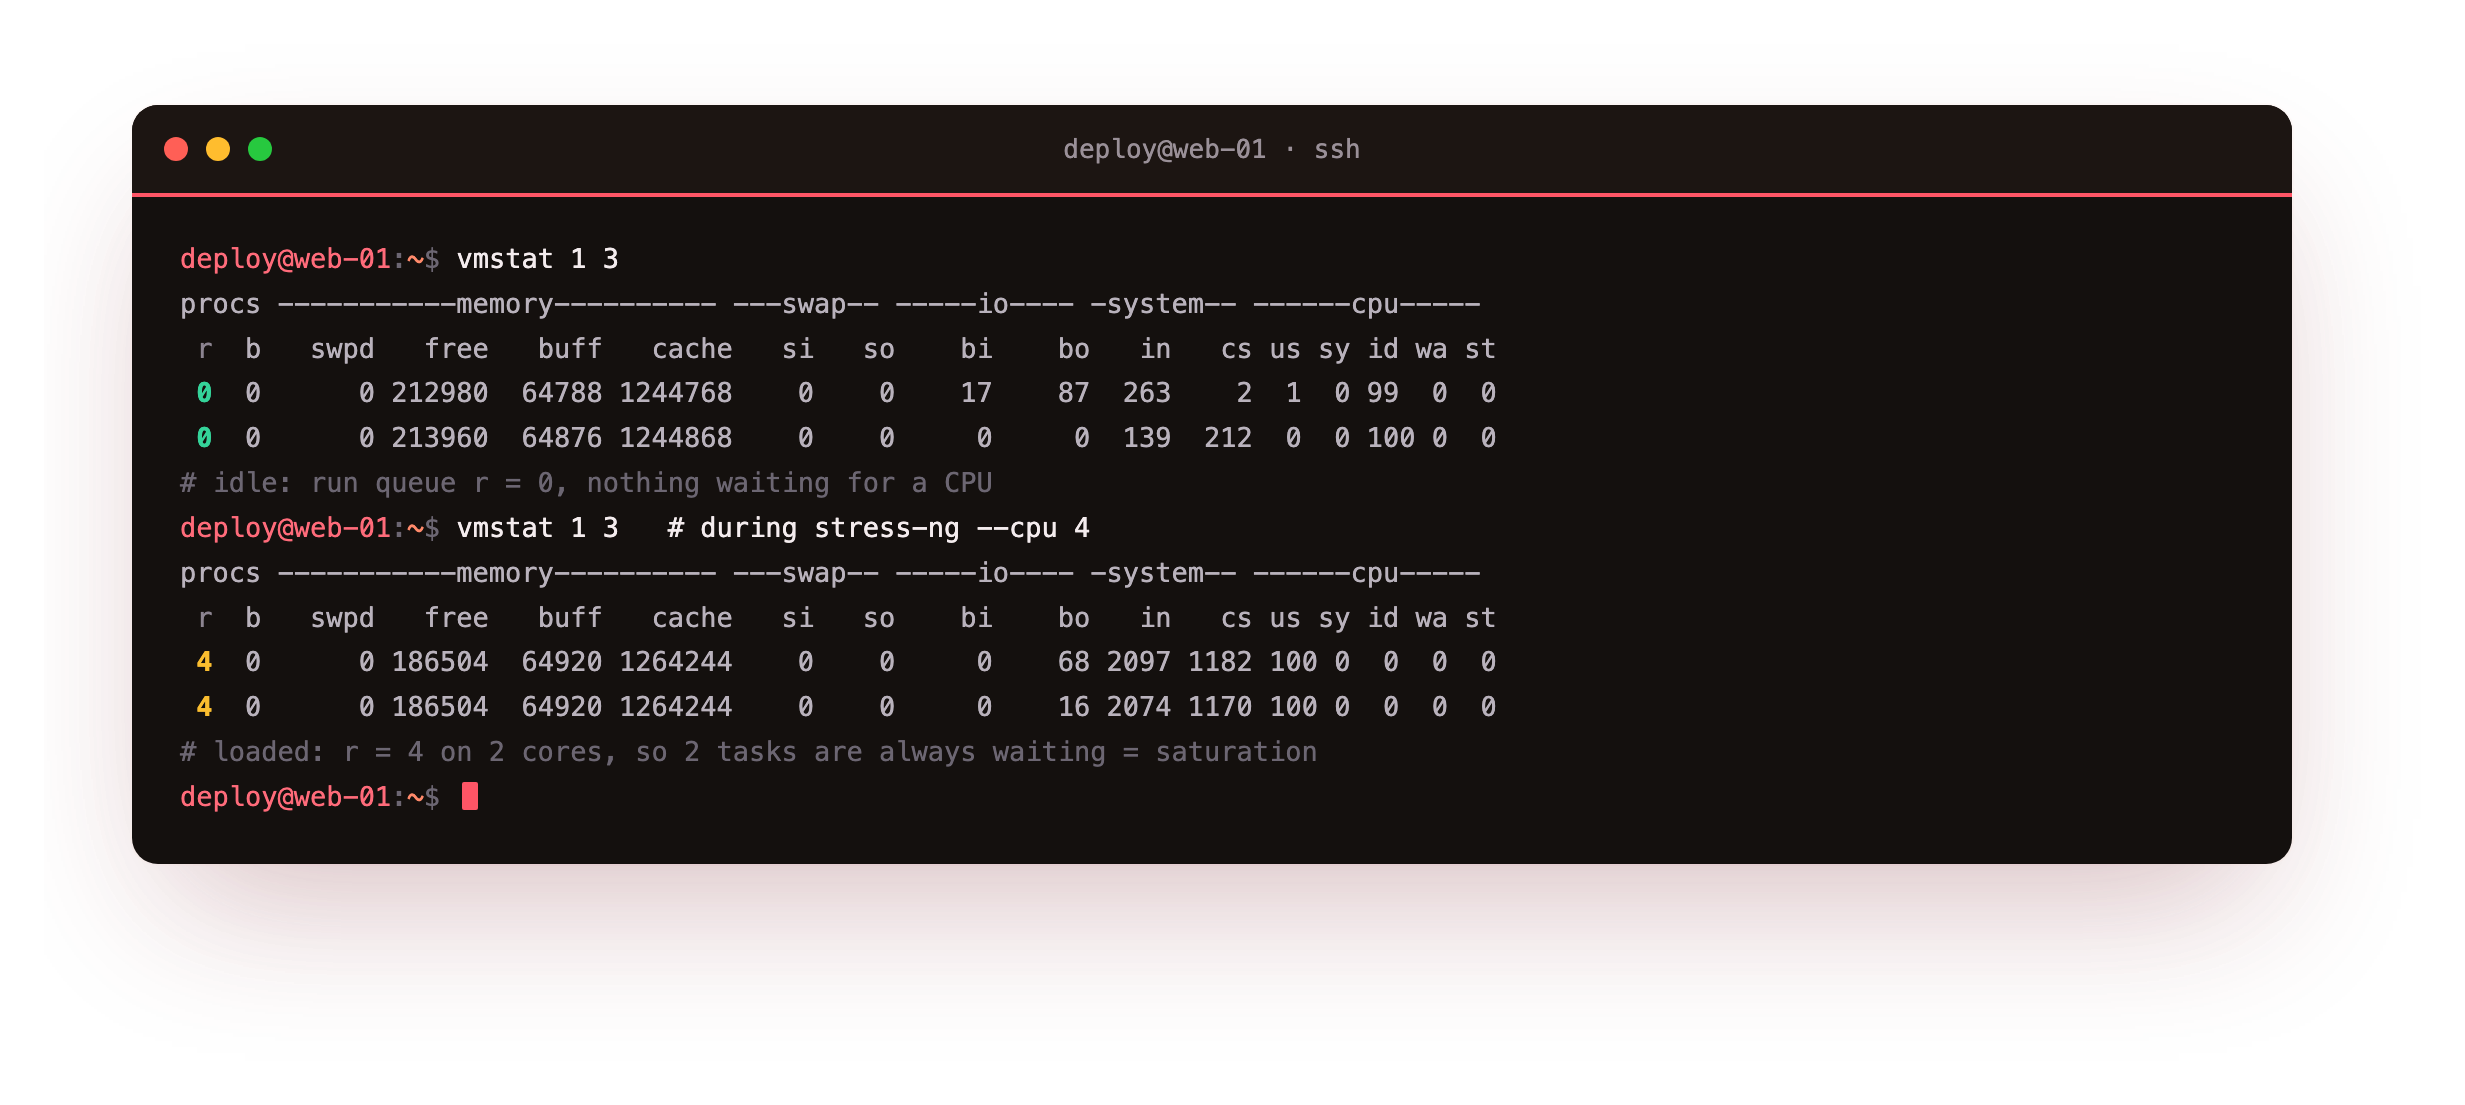
The first data column, r, is the run queue: tasks running or waiting for CPU right now. On the idle box r was 0. Under the four-worker load it sat at 4, while us showed 100 and id showed 0. A run queue of 4 on a two-core box is the clearest saturation reading you will get, two tasks on-CPU and two waiting every tick.
The same line also carries memory, swap, and disk columns, so one vmstat line summarises CPU, memory, and IO at a glance, which is why it is often the first command in a triage.
Idle, vmstat 1 should show r at 0 or 1 and id near 100. Under your stress-ng load, r should rise to about the number of workers and id should fall to 0. If r stays low while the b column climbs, tasks are blocking on IO rather than queuing for CPU, and you would follow the disk trail instead.
Going further: baselines and where errors come from
The value of these reads is comparison. An idle reading and a loaded reading of the same box, taken minutes apart, teach you what normal looks like so an abnormal reading stands out later. That baseline habit is the thing most teams skip, and it is the reason a slow server turns into a guessing game. Capture an idle uptime, top, and vmstat on a healthy box and keep them.
The Errors part of the USE method does not come from these three tools. It comes from the kernel log, which the triage playbook chapter pulls in with dmesg to catch a failing disk or an out-of-memory kill that masquerades as slowness. For now, hold the shape: utilisation and saturation from top and vmstat, errors from the logs.
Frequently asked questions
Is a high load average always bad?
No. Load counts tasks that are running or waiting, so you read it against the core count. A load of 2.0 on a two-core server means the CPUs are fully used with nothing queued, which is fine. The same load on a single core means half the work is waiting. High load with a high wa in top often points at disk, not CPU, so always pair the load figure with the CPU breakdown before you act.
What is the difference between utilization and saturation?
Utilization is how busy a resource is over an interval, such as 96 percent CPU. Saturation is how much extra work is queued because the resource cannot keep up, which for CPU is the run queue in vmstat or the load average above the core count. A resource can be fully utilised without being saturated. Saturation is the reading that predicts rising latency, so it is the one worth watching during triage.
Should I use top or htop?
htop is a friendlier front end with per-core bars, colour, and mouse support, and it is worth installing for interactive work. top is present on every server by default and runs in batch mode with top -bn1, which is what you want in a script or over a slow link. The fields mean the same thing in both, so learn the fields once. This series uses top so the steps work on a bare box.
Do I have to install anything to follow this series?
Yes, one package set. top, uptime, and vmstat ship with Ubuntu, but the per-core, per-process, and per-device tools do not. Running apt install sysstat stress-ng iotop fio brings in mpstat, pidstat, and iostat from sysstat, a bounded load generator in stress-ng, and the two disk tools. That single install is the from-zero starting point every later chapter assumes.
What you have, and what comes next
You started from a bare slice, installed the toolkit with one apt install, and saw the destination: a "the server is slow" panic turned into a named CPU bottleneck and four named processes. You then learned the USE lens and read utilisation and saturation directly, with uptime and nproc for the load against the core count, top for the category split, and vmstat for the run queue in one column.
That reading told you the pressure was CPU. The next chapter drills into exactly that: it reads per-core utilisation with mpstat to tell a pinned core from a saturated machine, names the hot process with pidstat, and shows what a virtualised kernel does and does not let perf measure: CPU saturation with mpstat and pidstat.