Measuring network throughput and socket state on Linux
Network throughput problems hide in socket state long before they show up as slow pages. A pile of connections stuck in TIME-WAIT, a listen queue overflowing, or a transfer capped by a small congestion window all leave a fingerprint you can read. This chapter uses ss to read socket states and TCP internals, measures throughput with a bounded transfer, and captures a few packets with tcpdump on a live Ubuntu 24.04 server. Every address here is on the loopback, so the output stays safe to publish.
ss -ssummarises all sockets by protocol and state, a fast first look at whether connections are piling up.ss -tanlists TCP sockets with state, so you can countLISTEN,ESTABandTIME-WAITat a glance.ss -tiexposes per-connection TCP internals such as congestion window, round-trip time and delivery rate.tcpdumpwrites packets to a file with-wand reads them back with-r, so you capture on the server and analyse offline.
Reach for ss first because it answers the common questions in one line. Drop to tcpdump only when you need to see the packets themselves, since a capture is heavier and needs care with what it records.
Reading socket states with ss
ss -s prints a one-screen summary. On this server it reported TCP: 33 (estab 6, closed 6, timewait 0) out of 232 total sockets. That single line tells you whether connections are accumulating in a bad state.
ss -s
For detail, ss -tan lists every TCP socket with its state and addresses, without resolving names so it stays fast.
ss -tan
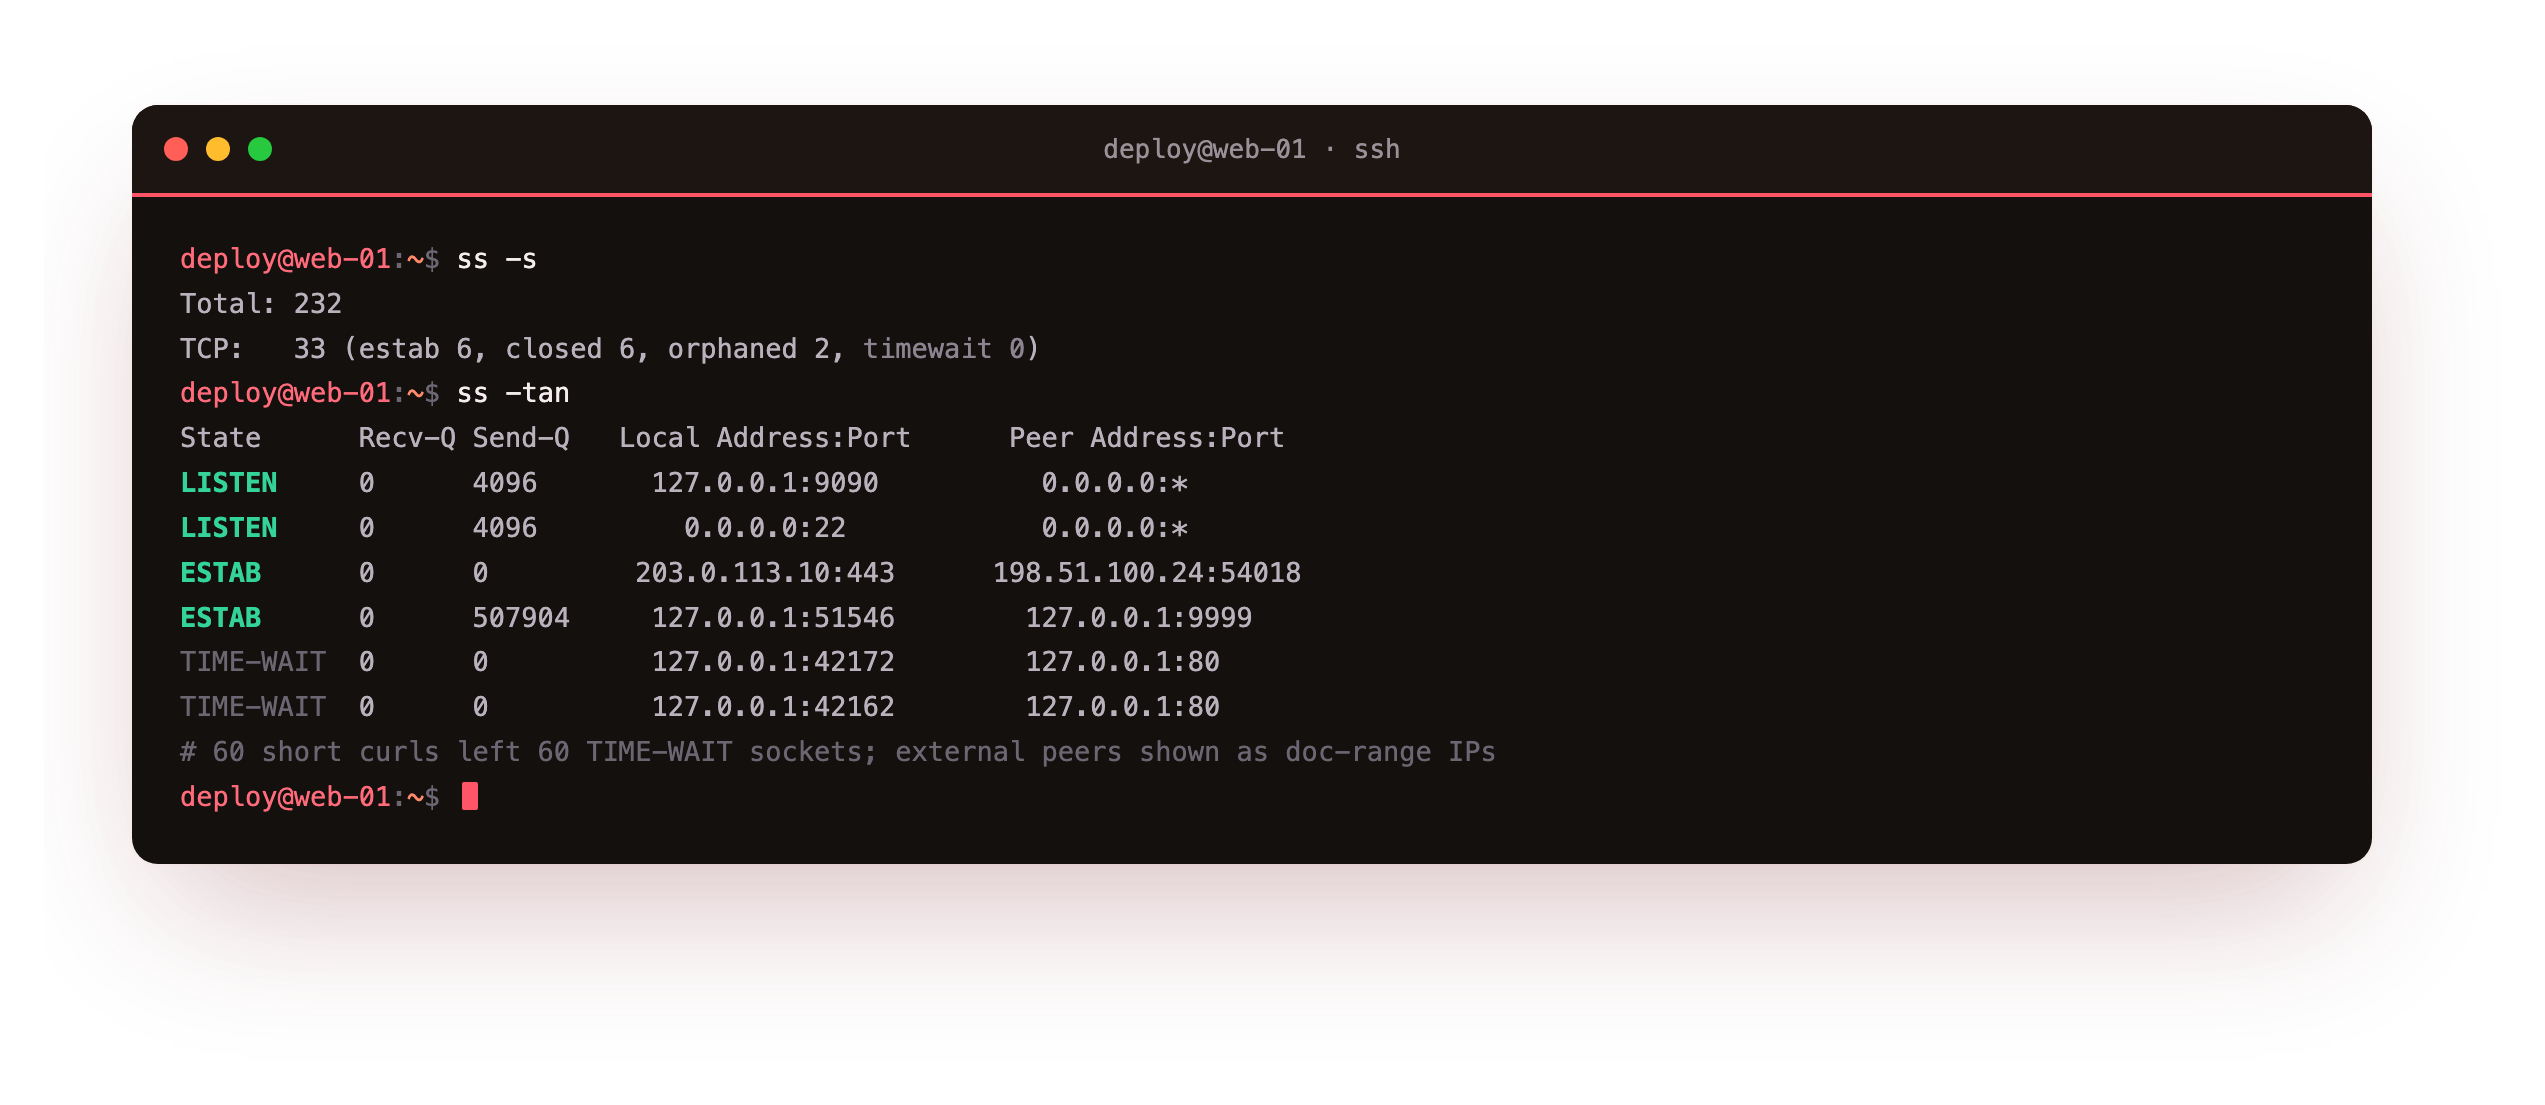
The LISTEN rows showed local services bound to 127.0.0.1 and the SSH daemon on 0.0.0.0:22. To make a state you can see, a burst of sixty short connections to the local web port left sixty sockets in TIME-WAIT, each a 127.0.0.1 peer. TIME-WAIT is normal: it is the two-minute wait the side that closed a connection holds to catch stray packets. A few thousand of them on a busy proxy is fine. Tens of thousands can exhaust local ports, which is when you tune the application to reuse connections.
On your box, ss -s should return a one-line summary and ss -tan should list your sockets by state. Confirm you can pick out the LISTEN, ESTAB, and TIME-WAIT rows. If a state you did not expect is piling into the thousands, that is the network fingerprint to chase before you blame throughput.
TCP internals with ss -i
Counting sockets is one view. ss -ti shows the health of a single connection: its congestion window, round-trip time, and how fast data is actually moving. During a loopback transfer between 127.0.0.1 ports, the sending socket reported real internals.
ss -tin
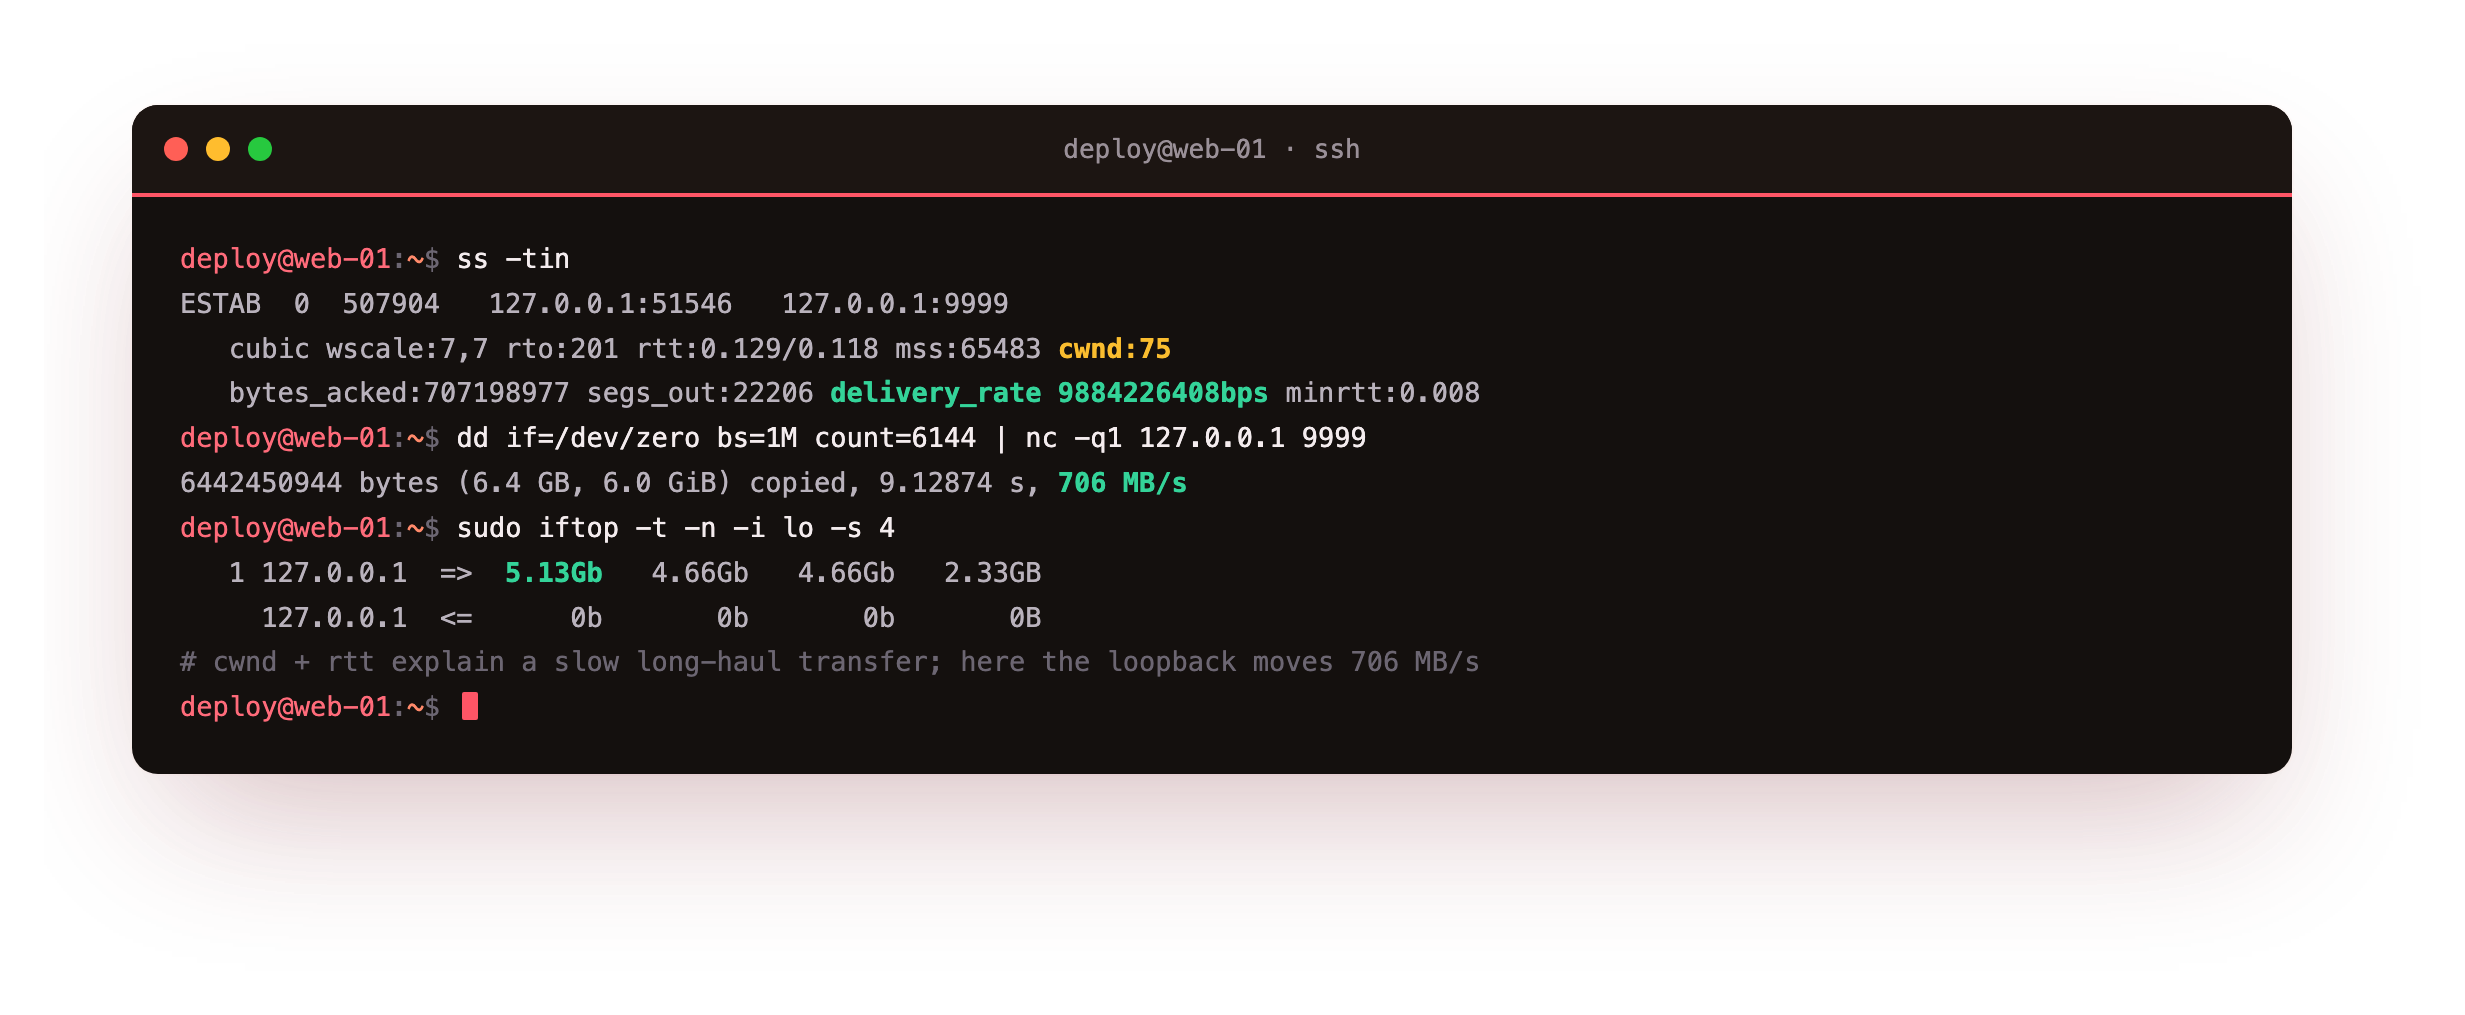
It showed cwnd:75, an rtt of 0.129 milliseconds, bytes_acked climbing past 700 megabytes, and a delivery_rate near 9.88Gbps. On a real link, a small congestion window paired with a high round-trip time is the reason a transfer never reaches the bandwidth you pay for, because TCP cannot keep enough data in flight. ss -ti is where you catch that, long before you blame the provider.
Measuring throughput
To measure throughput honestly, move real bytes and watch the rate. A netcat sink and a dd source over the loopback keep the test bounded and the addresses safe.
dd if=/dev/zero bs=1M count=6144 | nc -q1 127.0.0.1 9999
dd reported 6442450944 bytes copied, 9.12874 s, 706 MB/s. Watching the same transfer with iftop bound to the loopback interface showed a send rate peaking at 5.13Gb and a cumulative 2.33GB moved. On a production box you would run iftop -i eth0 to see per-connection bandwidth, but the loopback keeps this demo free of any real peer address. nload gives a simpler incoming-versus-outgoing graph if you prefer one number.
Going further: capturing packets with tcpdump
When counts and rates are not enough, capture the packets. tcpdump writes a binary capture with -w, which you read back later with -r, so you never have to parse output live.
sudo tcpdump -i lo -c 12 -w /tmp/cap.pcap 'tcp port 9999'
Reading the file back showed the handshake and the data flow in order.
sudo tcpdump -r /tmp/cap.pcap -n
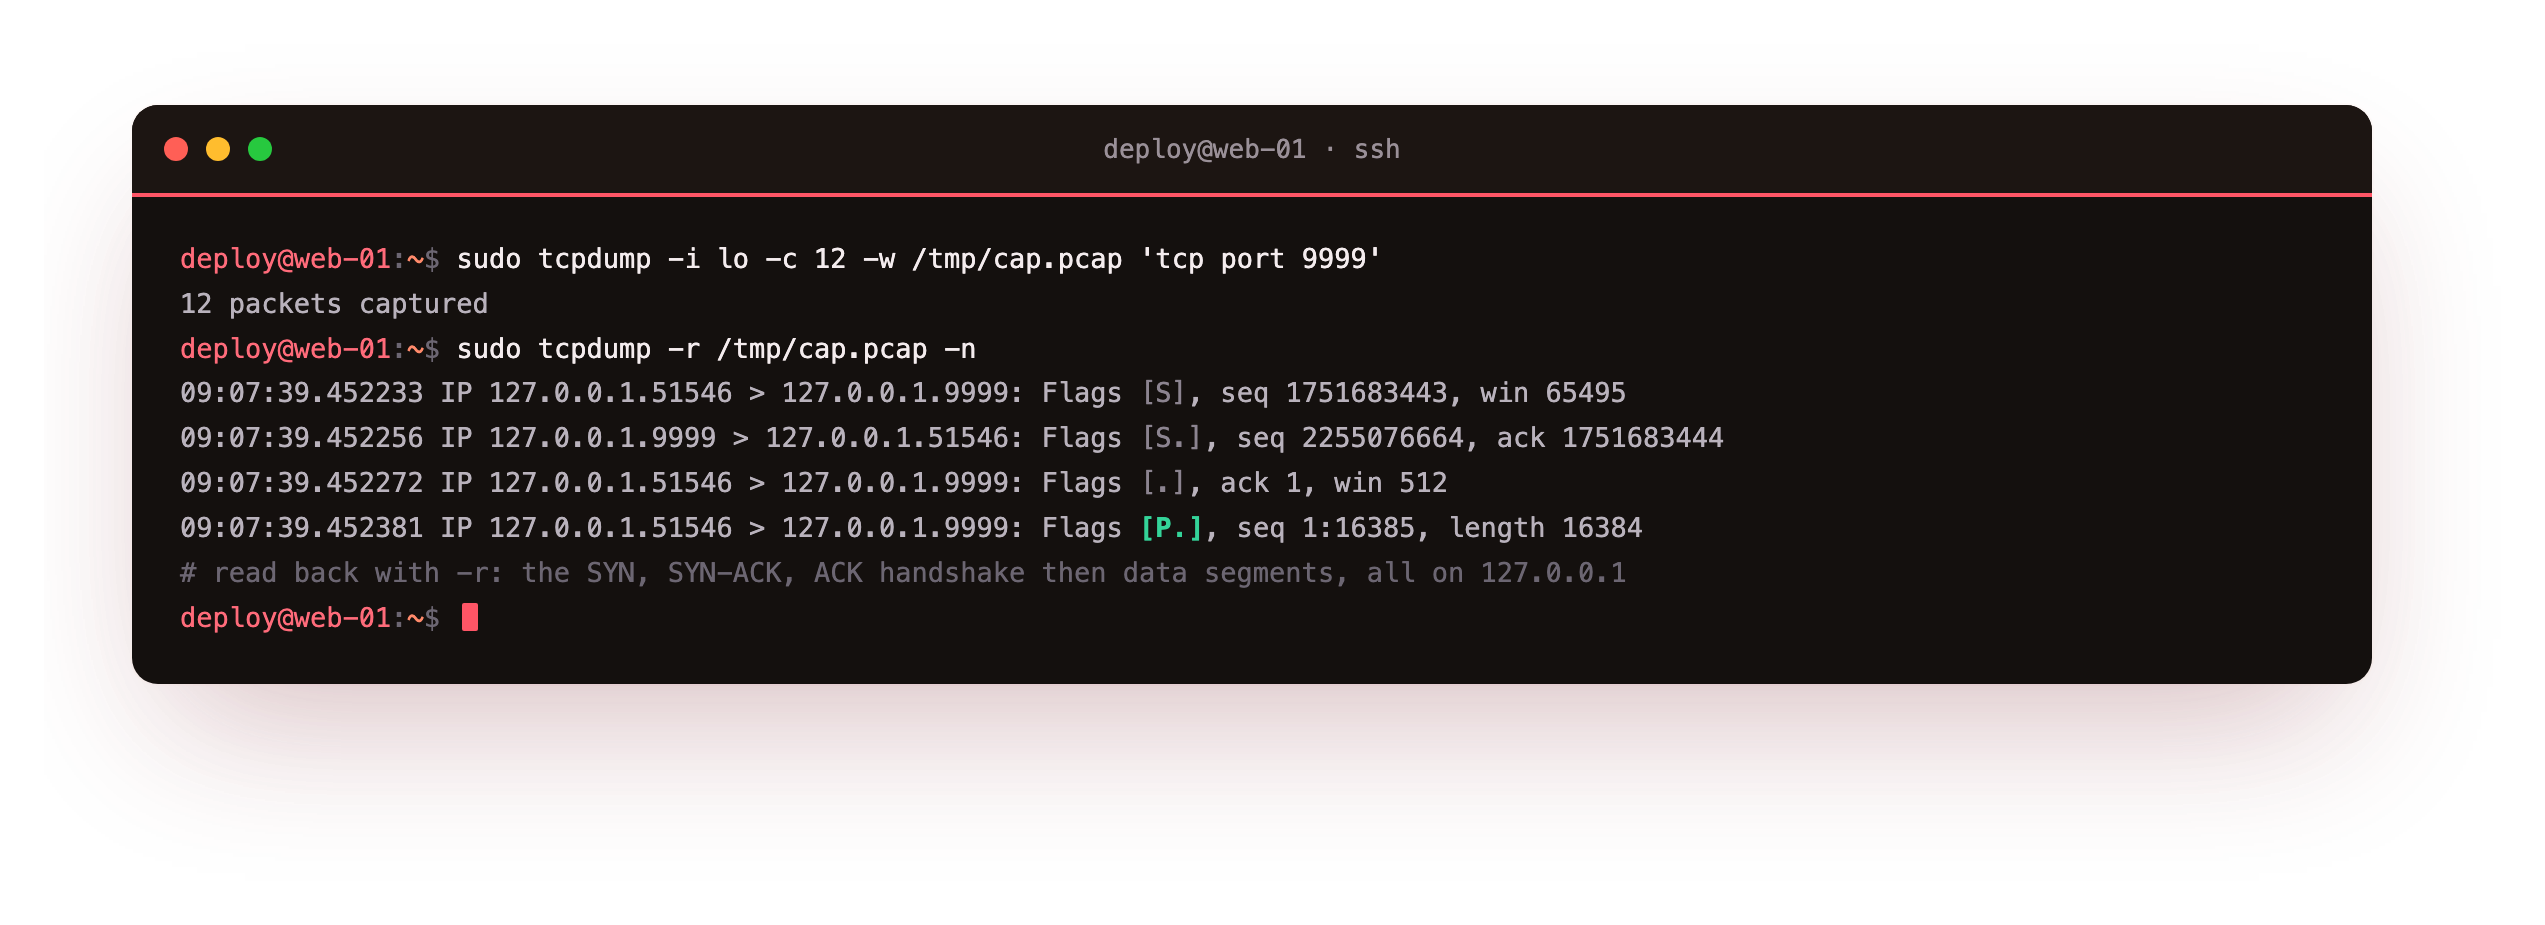
The first three packets were the TCP handshake: a [S] from the client, a [S.] from the server, and the client's [.] acknowledgement, all between 127.0.0.1 ports. After that came [P.] data segments carrying the payload. Capturing to a file and reading with -r keeps two habits: the capture is bounded by -c 12, and you analyse it off the box. On a real interface, always scope the filter tightly and treat the capture as sensitive, because packets can carry real addresses and payloads.
Frequently asked questions
Are lots of TIME-WAIT sockets a problem?
Usually not. TIME-WAIT is the normal state the closing side of a TCP connection holds briefly to absorb late packets, and it clears itself. It becomes a problem only when a busy client or proxy opens and closes so many short connections that it runs low on local ports. The fix is connection reuse in the application, such as keep-alive or a connection pool, not disabling the wait, which exists for correctness.
When should I use ss instead of netstat?
Prefer ss. It reads socket data straight from the kernel and is faster on a busy server, and it offers richer filters and the -i flag for per-connection TCP internals that netstat does not show. netstat still works and its output is familiar, but on modern Ubuntu it is not installed by default. Learning ss -tan and ss -s covers almost everything you reached for netstat to do.
How do I capture packets without leaking sensitive data?
Scope the capture with a tight filter, limit it with -c so it stops after a set number of packets, and write to a file with -w for offline analysis. Capture only the port or host you are debugging, and treat the file as sensitive, since it can contain real addresses and unencrypted payloads. For a shareable example, capture on the loopback as this chapter does, where every address is 127.0.0.1.
What does the congestion window tell me?
The congestion window, shown as cwnd in ss -ti, is how many segments TCP will send before it waits for acknowledgements. On a high-latency link, a small window caps throughput because too little data is in flight to fill the pipe. If a long-distance transfer runs far below the available bandwidth, check cwnd and rtt together. A small window with a high round-trip time is the signature of a latency-limited, not bandwidth-limited, transfer.
What you have, and what comes next
You can now read socket state with ss -s and ss -tan, inspect a single connection's congestion window and delivery rate with ss -ti, measure real throughput with a bounded transfer, and capture packets to a file with tcpdump for offline reading. You saw a loopback transfer move 706 MB/s and read its handshake packet by packet, all without a real address in the output.
The next chapter ties the whole series together into a sixty-second triage playbook, running these tools in sequence to diagnose a slow server, with a worked example that finds one planted bottleneck end to end.