Reading disk IO on Linux with iostat
Disk IO is where a server that looks idle on CPU can still crawl, because processes sit blocked waiting for the storage to answer. The tell is a high wa in top and a rising load with cores mostly idle. This chapter reads disk IO on a live Ubuntu 24.04 server with iostat -xz, names the process behind it with iotop and pidstat, and separates latency from throughput using bounded dd and fio workloads so the figures are measured, not guessed.
iostat -xz 1gives per-device utilisation (%util), latency (await), and throughput (rkB/s,wkB/s) in one view.- A device near 100 percent
%utilwith a risingawaitis saturated, and the queue lengthaqu-szconfirms work is backing up. iotopandpidstat -dattribute the reads and writes to a specific process, so you fix the cause not the symptom.- Latency and throughput are different questions: a device can push high megabytes per second while each small request still waits.
The device numbers tell you the storage is busy. The per-process view tells you who to talk to. You need both, because throttling the wrong service does nothing.
Reading iostat: %util, await and throughput
iostat -xz 1 prints extended, per-device statistics each second and skips idle devices. On the quiet server the root disk sda sat near 0.07 %util. Then a bounded write load, a loop of dd writing with direct IO and an fsync per chunk, changed the picture.
iostat -xz 1
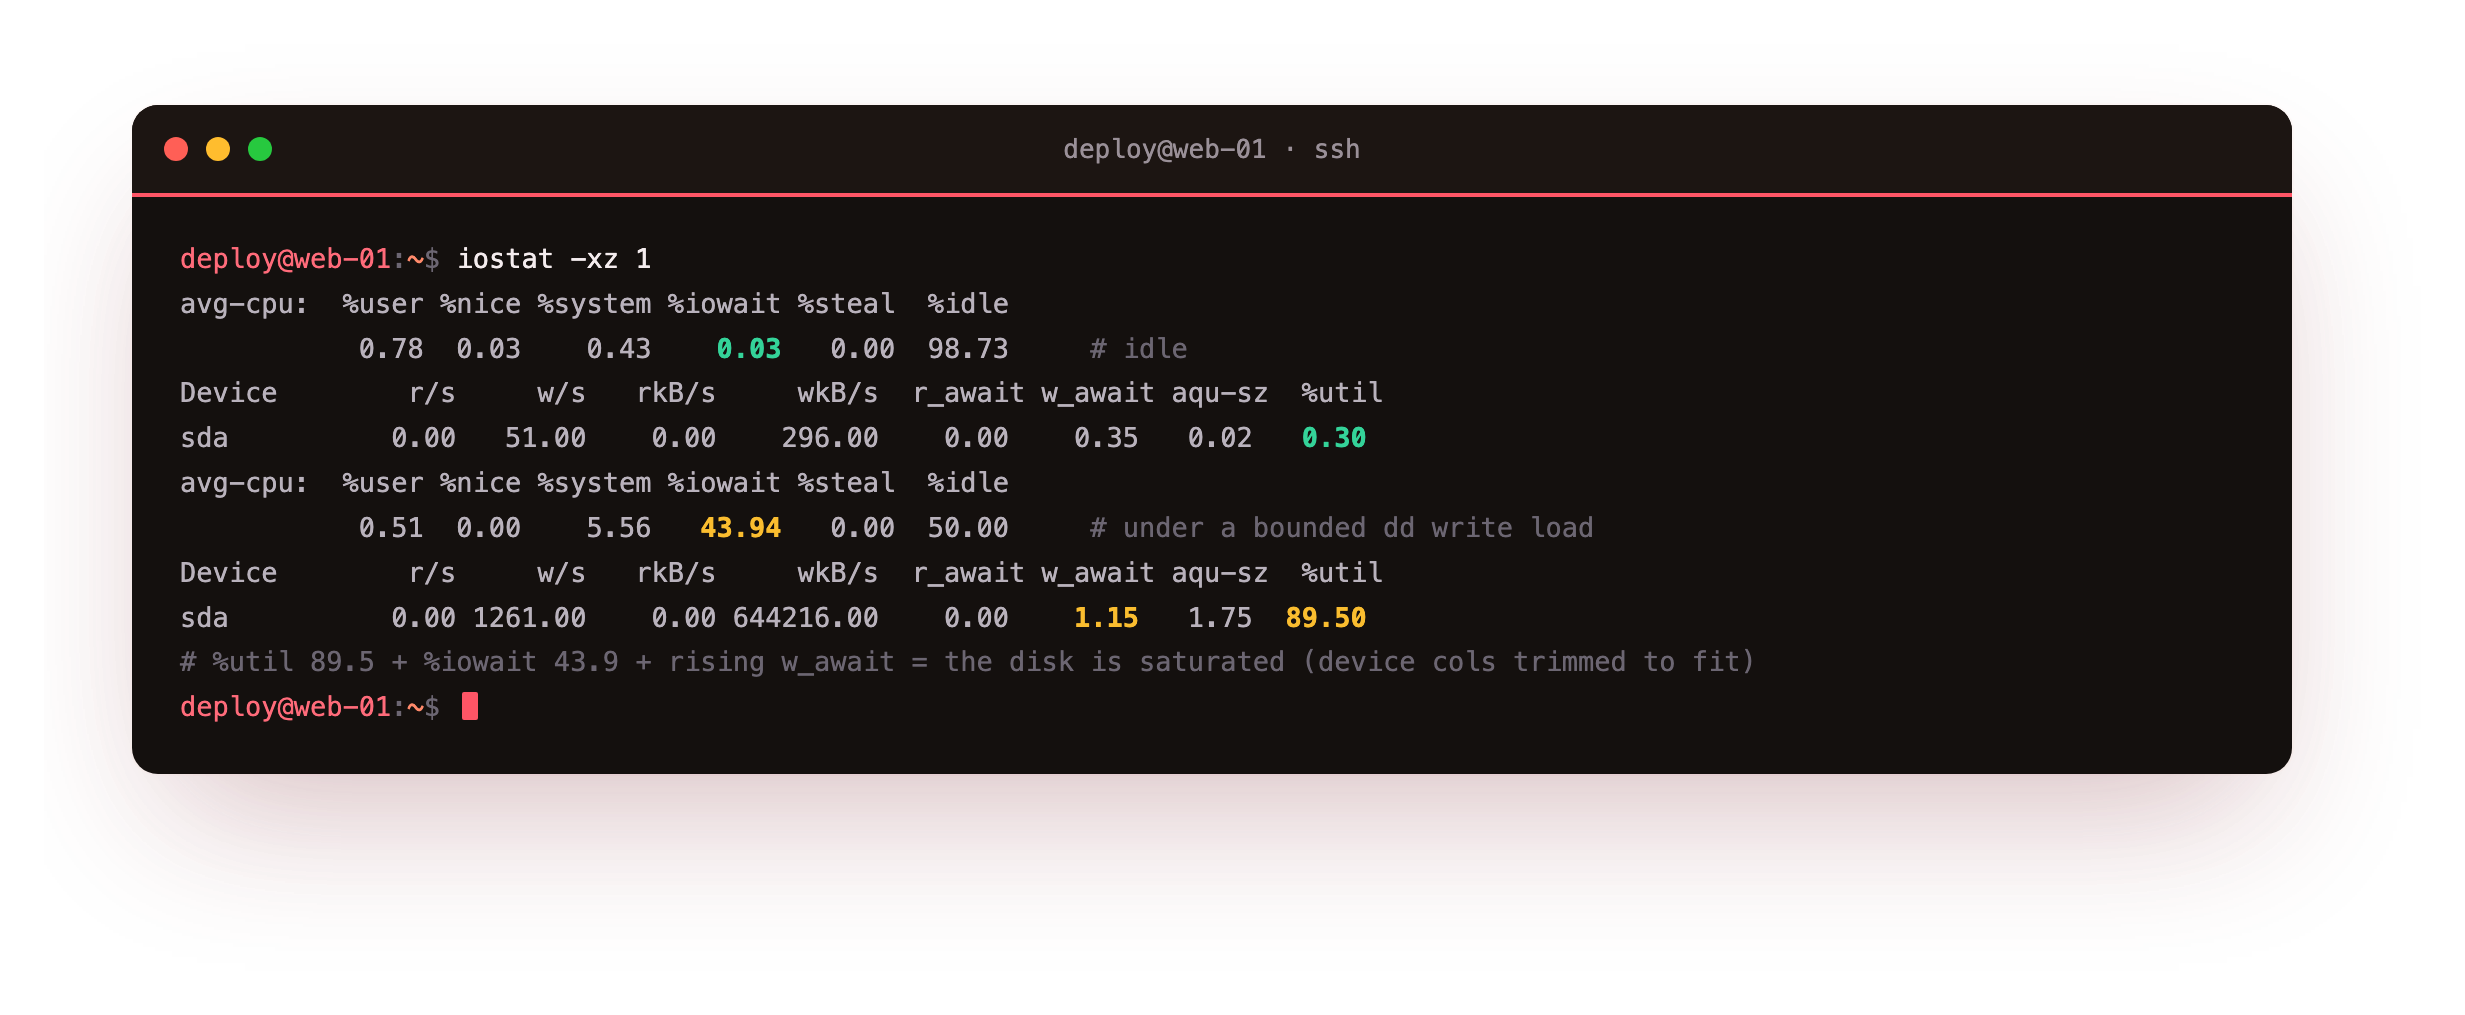
Under load, sda reported around 640216 wkB/s, a %util of 89.50, a w_await near 1.15 ms, and an average queue size aqu-sz of about 1.8. The CPU line alongside it showed %iowait at 45, meaning nearly half of every interval the CPU had nothing to do but wait for the disk. That combination, high %util and high %iowait, is the classic disk saturation signature. await is the average time a request took start to finish, so a climbing await under load is your latency warning.
Idle, iostat -xz 1 should skip sda or show a %util near zero. Under a write load it should show %util climbing toward 100 with a rising w_await and a matching %iowait on the CPU line. That is the disk saturating. If %util stays low while the app still feels slow, the bottleneck is elsewhere and you step back to the USE reads from chapter one.
Finding the process behind the IO
A busy device is only half the answer. iotop shows live per-process disk IO and, with -o, only the processes actually doing IO.
sudo iotop -boP
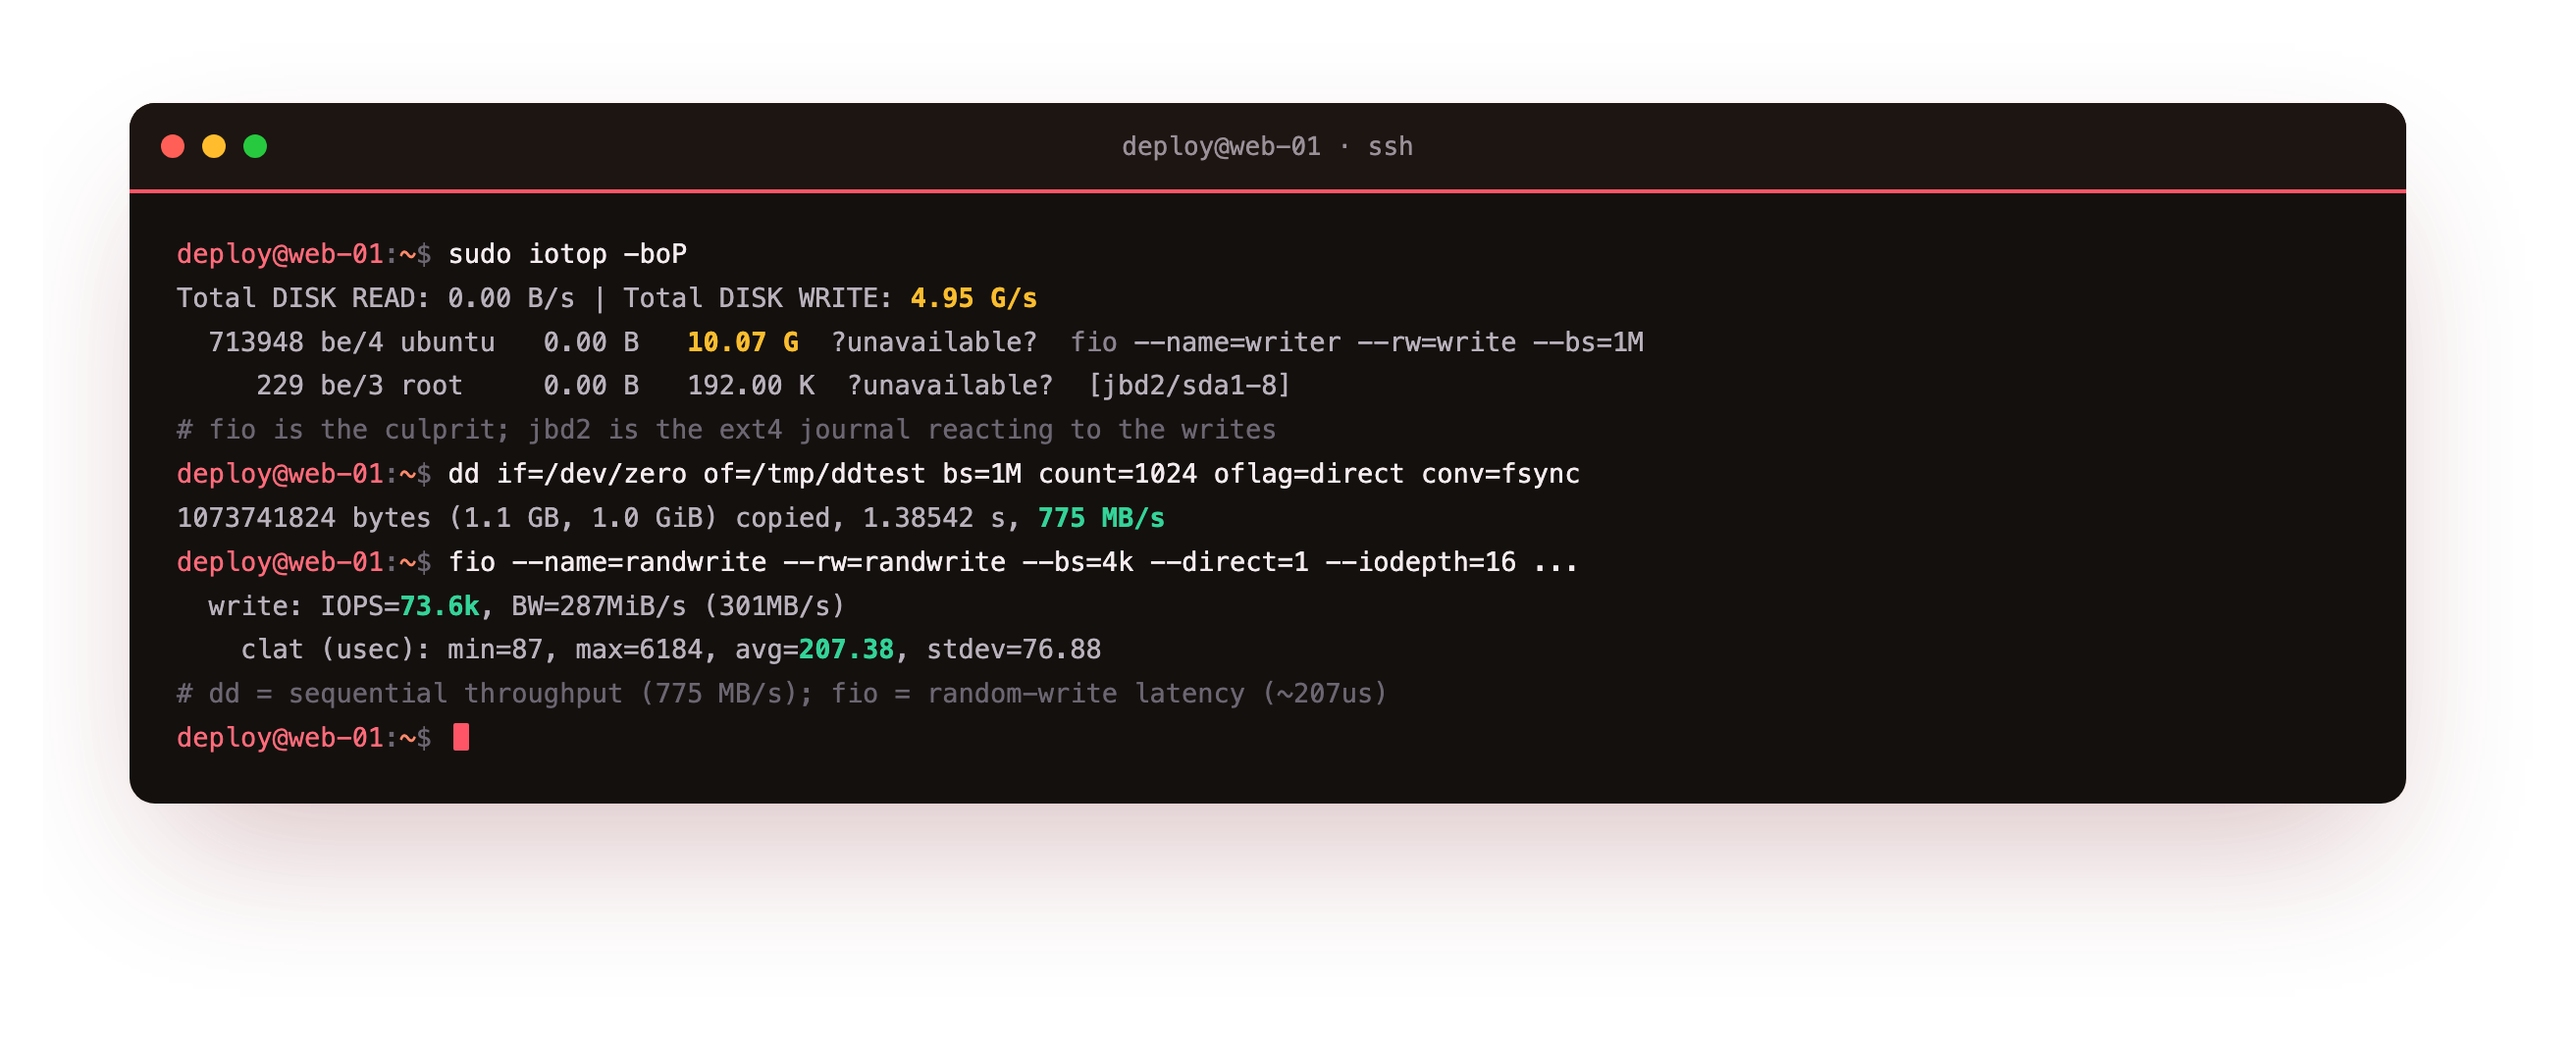
Against a sustained fio writer, iotop named PID 713948, the fio process, as the writer, alongside jbd2/sda1-8, the ext4 journal thread that commits filesystem metadata. pidstat -d gives the same attribution in a form that is easy to log.
pidstat -d 1
It showed the fio process writing at a high kB_wr/s, and nothing else close. In a real incident this is the moment the investigation narrows: you have a device saturated and a single process responsible, so you can look at that service's write pattern rather than blaming the disk.
The kB_rd/s and kB_wr/s columns split reads from writes, which matters for the fix. A process reading heavily may benefit from more page cache, while one writing heavily may be flushing too often or logging without a buffer. The iodelay column is the time the process itself spent blocked on IO, so a high iodelay on the process you care about confirms the disk is the reason it feels slow, not a coincidence alongside it.
Throughput versus latency
Throughput and latency answer different questions, and mixing them up leads to wrong conclusions. Measure throughput with a large sequential write. Direct IO with an fsync bypasses the cache so the number reflects the device.
dd if=/dev/zero of=/tmp/ddtest bs=1M count=1024 oflag=direct conv=fsync
This reported 1073741824 bytes copied, 1.38542 s, 775 MB/s. That is a throughput figure: how much bulk data the device moves per second. It says nothing about how a single small request feels. For that, measure latency with a random small-block workload.
fio --name=randwrite --filename=/tmp/fiofile --rw=randwrite --bs=4k --size=256M --runtime=12 --time_based --direct=1 --ioengine=libaio --iodepth=16
fio reported IOPS=73.6k, a bandwidth of 287MiB/s, and a completion latency clat averaging 207 usec, with 84 percent of requests finishing under 250 microseconds. Read those together: the device sustains high throughput and low per-request latency here, which is healthy. When a database feels slow, it is usually the latency figure, not the throughput, that has degraded, so measure the one that matches the complaint. Remember to remove the test files afterwards so the demo leaves no large files behind.
Frequently asked questions
What does high %util actually mean?
%util is the fraction of time the device had at least one request in flight. On a single spinning disk, near 100 percent means saturation. On modern SSDs and virtualised storage that serve many requests in parallel, %util can read high while the device still has headroom, so pair it with await and aqu-sz. A high %util with a low, steady await is busy but fine. A rising await is the real warning.
Why is my load high when the CPU is idle?
Load counts tasks waiting on any resource, including disk. Processes blocked in uninterruptible IO wait still count toward the load average, so a disk-bound server shows a high load while top reports mostly idle CPU with a large wa. Confirm it with iostat -xz: a saturated device and a high %iowait explain the load. The fix is on the storage or the process writing to it, not on the CPU.
Should I benchmark with dd or fio?
Use dd for a quick sequential throughput check, with oflag=direct conv=fsync so it measures the device and not the cache. Use fio when you need latency, random access, or a specific block size and queue depth, because it models a real workload far better. For a database or a busy web app, the fio random small-block latency is the number that predicts how the app will feel, so it is worth the extra setup.
What is the jbd2 process in iotop?
jbd2 is the journaling thread for an ext4 filesystem, named after the device such as jbd2/sda1-8. It commits filesystem metadata, so it appears in iotop whenever there is write activity, even when your application is the real source. Do not chase it as the culprit. Treat it as a sign that writes are happening and look one line up for the process generating them, which is the service you actually need to address.
What you have, and what comes next
You can now read a disk with iostat -xz, separate a busy device from a saturated one using %util, await and aqu-sz, and attribute the IO to a process with iotop and pidstat -d. You also measured throughput and latency as the distinct questions they are, with dd reporting 775 MB/s of bulk write and fio reporting 73.6k IOPS at about 207 microseconds per request.
The next chapter moves to the network. It reads socket states with ss, watches a bounded transfer for throughput, and captures a few packets with tcpdump, keeping every address on the loopback so nothing real leaks into the output.