When the server is slow, run a fixed sequence
"The server is slow" is a complaint, not a diagnosis. The four preceding chapters each read one resource in depth; this chapter draws those reads into a single ordered pass, so you rule the CPU, memory, disk, and network in and out instead of poking at guesses.
This chapter is that sixty-second playbook: eight commands in order on a live Ubuntu 24.04 server, what each one tells you, and a worked example that plants a single bottleneck and traces it end to end until one process is named.
- Run the same ordered checklist every time so triage is muscle memory, not improvisation under pressure.
uptimeandvmstattell you within seconds whether the pressure is CPU, memory, or disk.- A high load with a high
waand idle CPU points at disk, andiostatpluspidstat -dname the process. - Ending on the process, not the resource, is the point: you fix a cause when you can name the program behind it.
The order matters. Start broad with load and the run queue, then follow the evidence toward the busy resource, and finish by attributing it to a process. The worked example below shows the whole path.
The sixty-second checklist
Here is the sequence, with what each command rules in or out. Run them top to bottom and stop drilling once one resource is clearly the constraint.
| Command | Reads | Rules in / out |
|---|---|---|
uptime | Load vs core count | Is anything queued at all |
dmesg -T | tail | Kernel errors, OOM | Hardware, OOM kills, resets |
vmstat 1 | Run queue, swap, IO | CPU vs memory vs disk |
top -bn1 | us / sy / wa / id split | User code vs kernel vs wait |
mpstat -P ALL 1 | Per-core utilisation | One core vs all cores |
iostat -xz 1 | Device util, latency | Which disk, how saturated |
pidstat -d 1 | Per-process IO | Which process writes |
free -h and ss -s | Memory, sockets | Memory pressure, connection pileup |
Memorise the shape, not the exact flags. The goal is to move from "something is wrong" to "this resource is the constraint" in the first four commands, then to "this process is the cause" in the last four.
A worked example, start to finish
To show the path, I planted one bottleneck: four processes writing to disk synchronously, each forcing an fsync per block so they block on the storage. Then I ran the checklist. First, uptime and vmstat.
vmstat 1
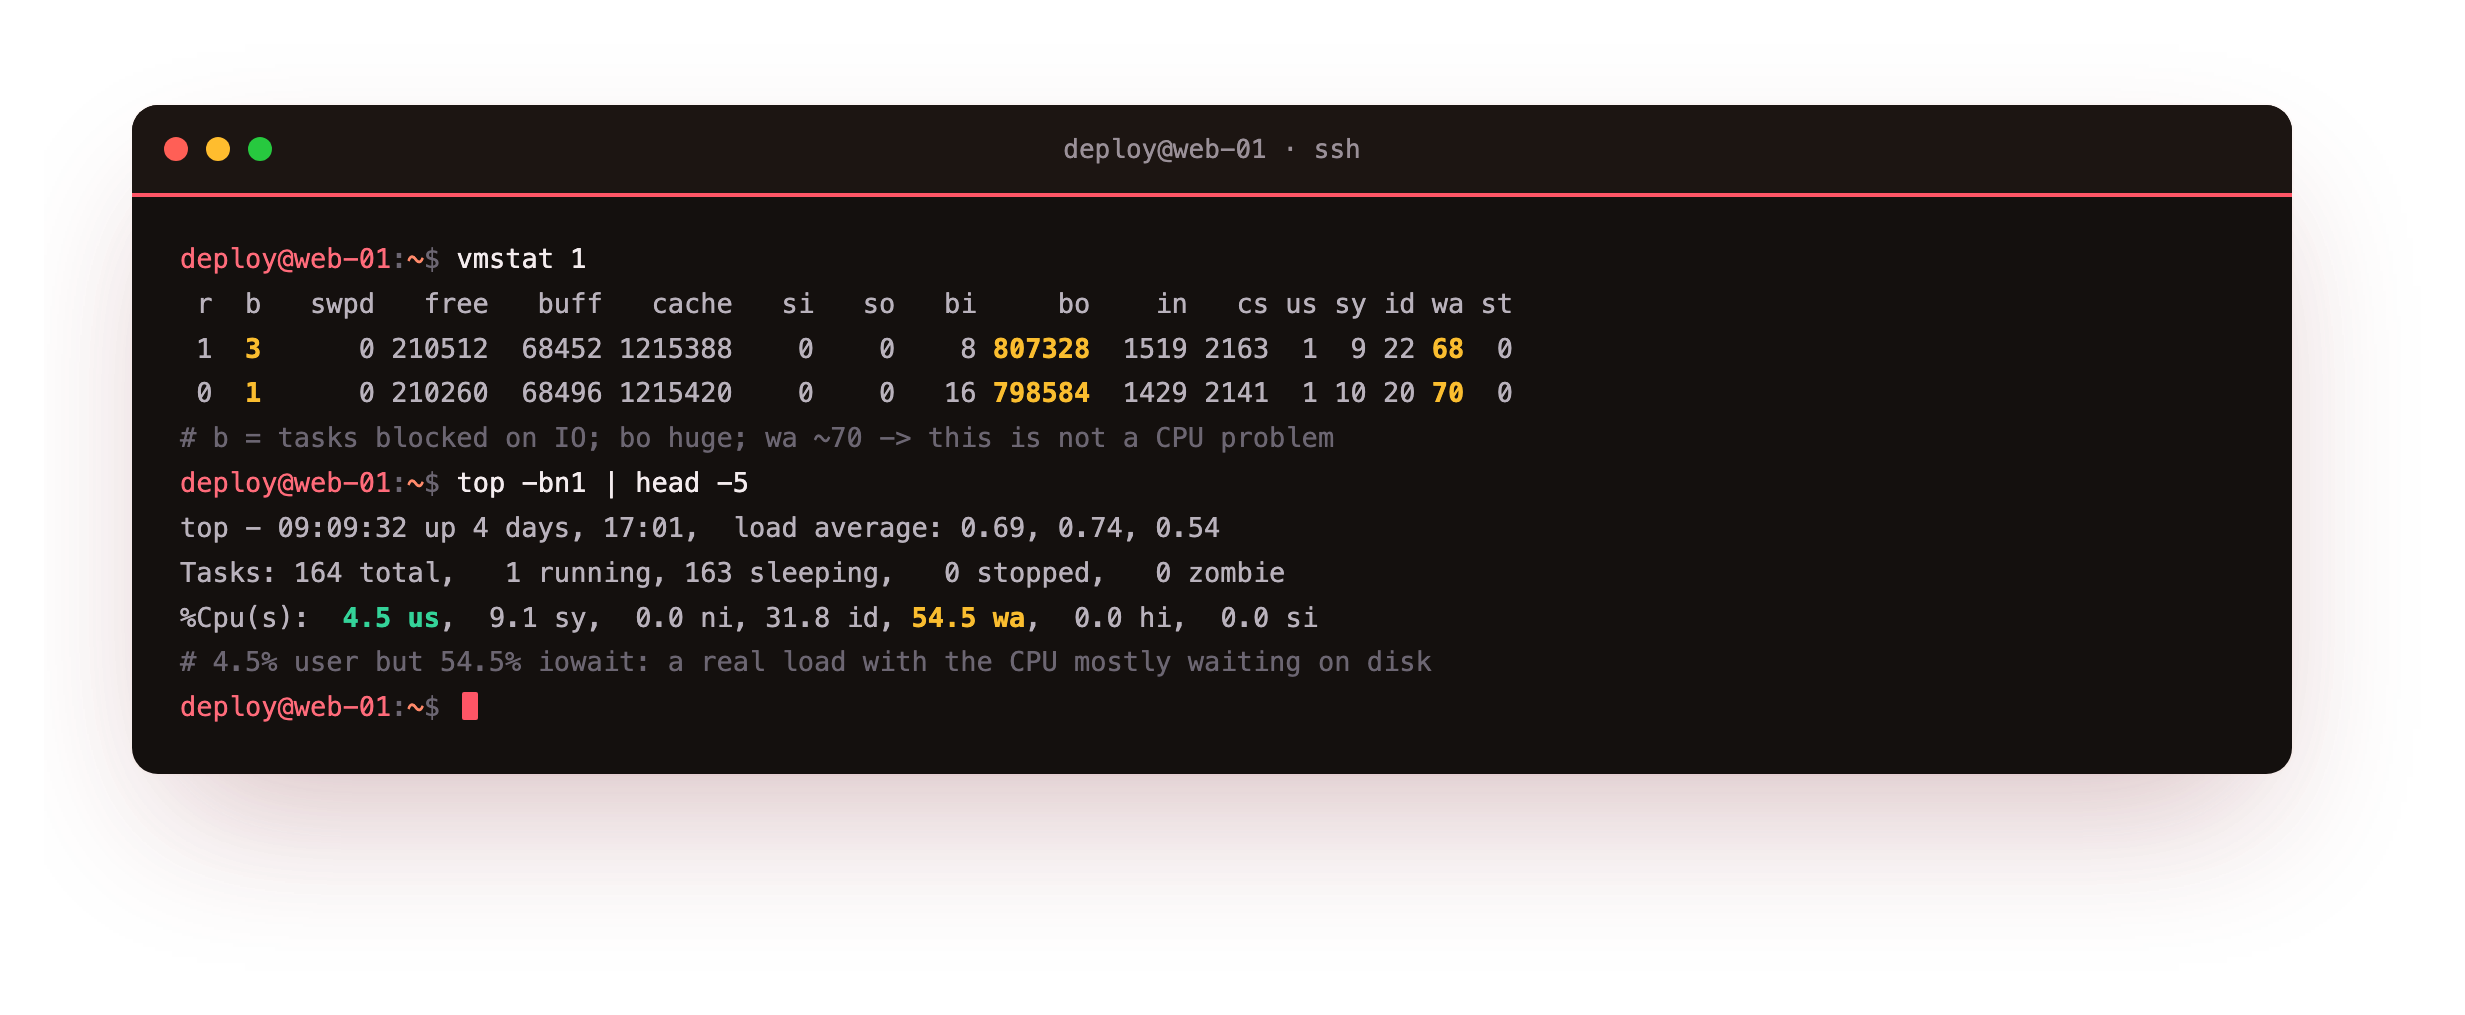
vmstat showed the run queue r low but the blocked column b at 3, the bo block-out column above 800000, and the wa column at 70. That already narrows it: tasks are blocked and the CPU is spending its time waiting, so this is not a CPU problem. top confirmed the split.
top -bn1 | head -5
The header read 4.5 us, 9.1 sy, 31.8 id, 54.5 wa. Only 4.5 percent user time, but 54.5 percent waiting on IO. A server can have a real load while the CPU is mostly idle, and this is exactly that case. mpstat agreed, reporting %iowait at 69.39 across both cores. The direction is now certain: the constraint is disk, so drop to iostat.
iostat -xz 1
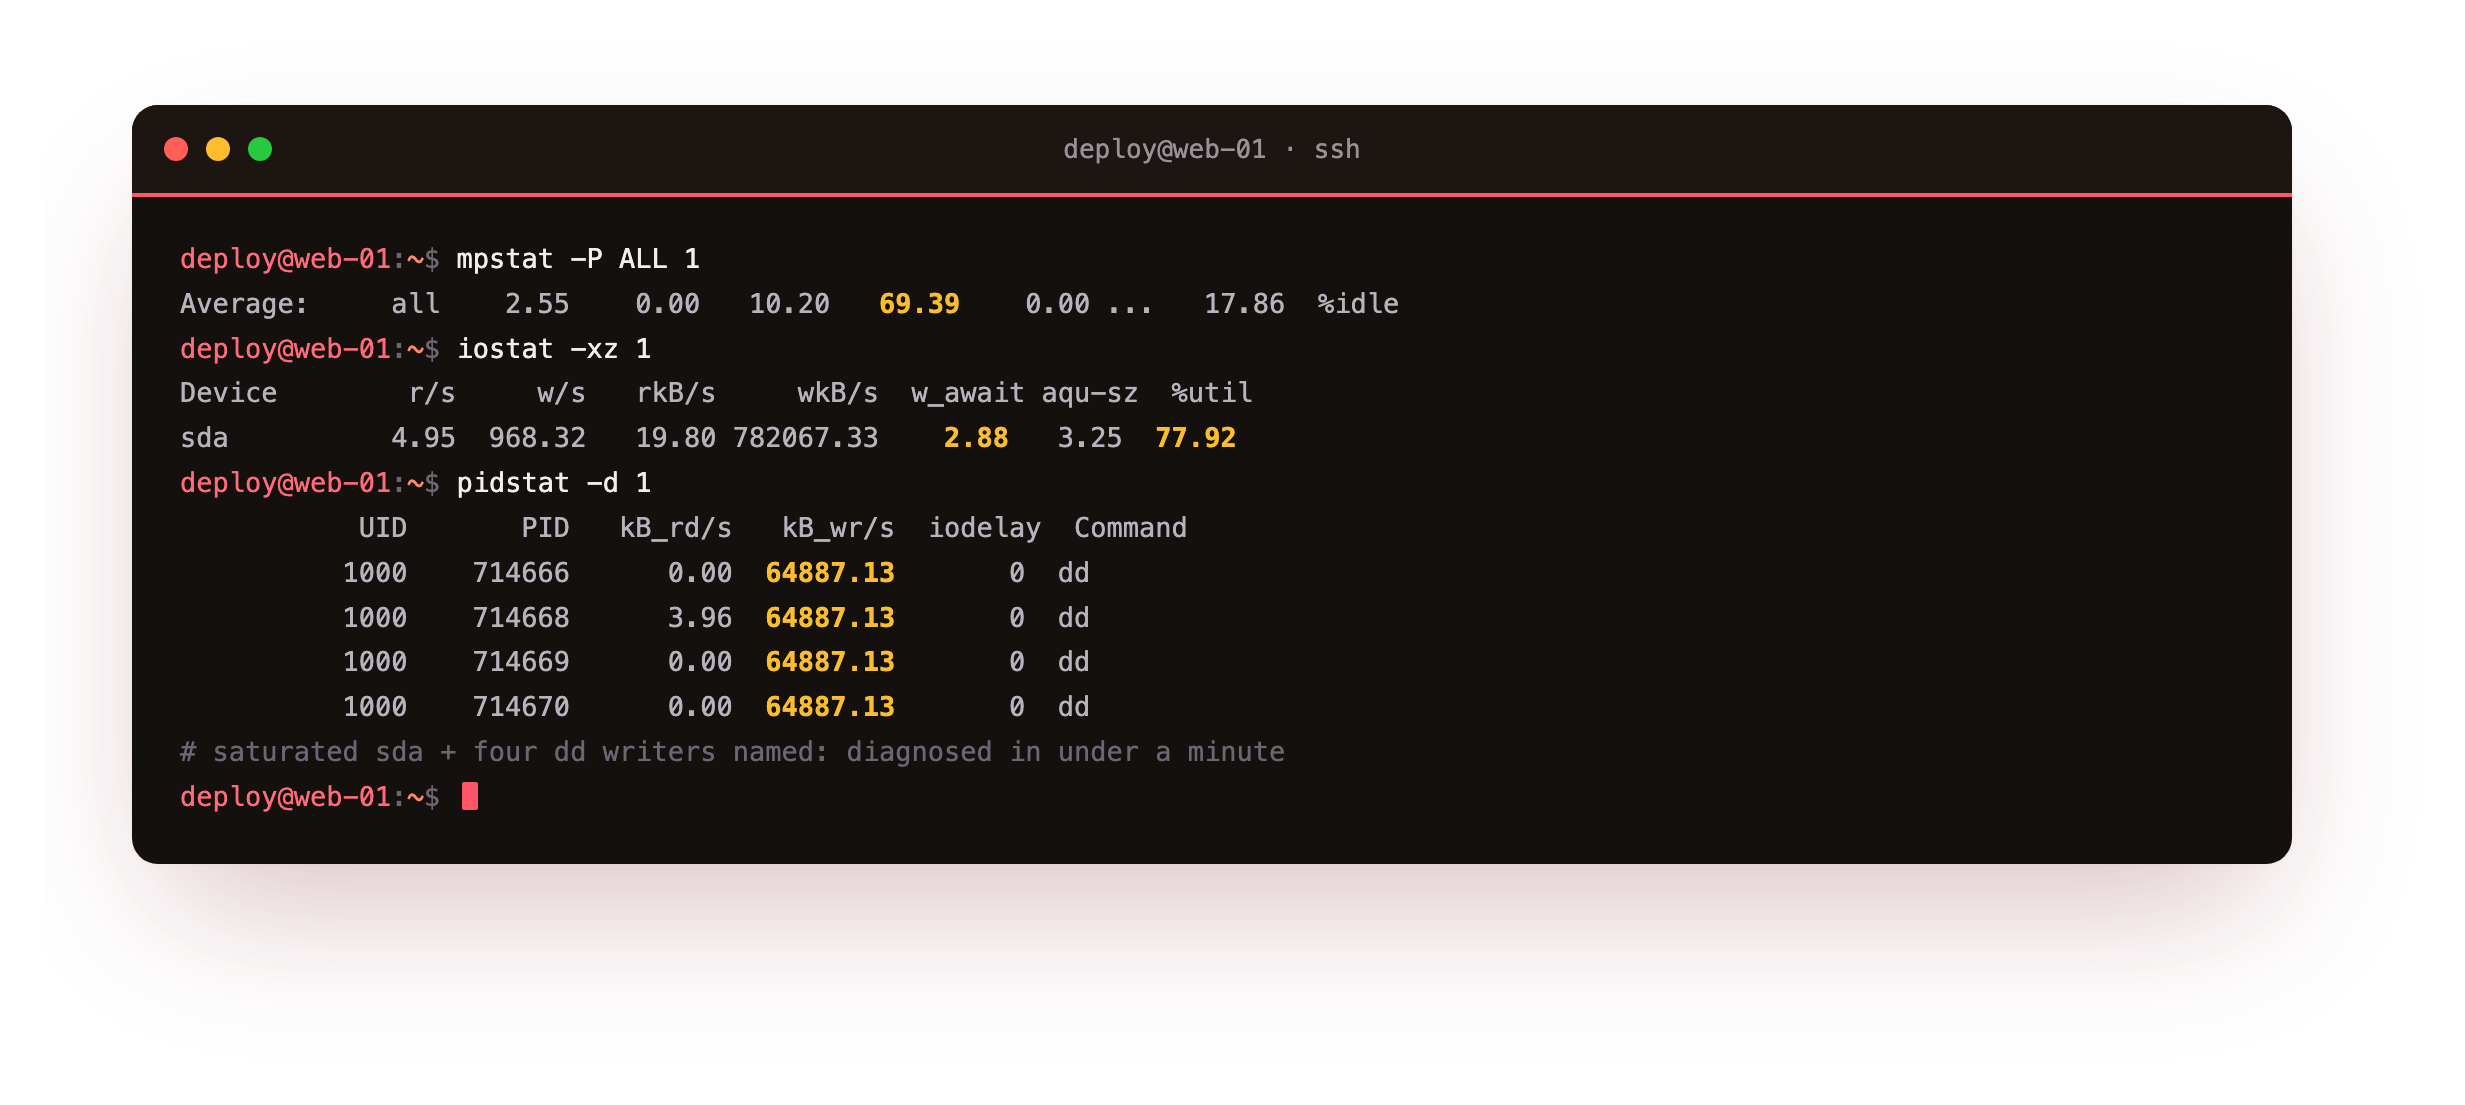
sda showed a %util of 77.92, writes of about 782067 wkB/s, a w_await near 2.88 ms, and a queue that had grown. The device is saturated with writes. One question remains: which process. pidstat -d closed it out.
pidstat -d 1
It listed four dd processes, each writing around 64887 kB_wr/s, and nothing else near them. That is the end of the trace: a slow server, diagnosed in under a minute as disk-write saturation caused by four specific processes. In production those would be a runaway backup job or a misconfigured logger, and now you know which to stop. A quick free -h and ss -s ruled out memory pressure and a socket pileup, so the case is closed.
Plant a load on your own box and run the sequence. You should be able to state the constraint after vmstat and top, and name the process by pidstat, without opening a tool for the wrong resource. If you cannot yet name a single process at the end, keep drilling with the resource-specific tool the checklist points to, because the trace is not finished until a process is named.
Why the order beats intuition
The reason to run a fixed sequence is that intuition sends you to the wrong resource. A high load average feels like a CPU problem, so people open top, see idle CPU, and get confused. The checklist avoids that by reading the run queue and the wa split before anything else, which points at disk immediately.
dmesg early catches the cases that look like performance but are really a failing disk or an OOM kill. Ending on pidstat forces the trace to a process, which is the only thing you can actually act on. Write the eight commands on a card and run them the same way every time.
Frequently asked questions
What is the very first command to run on a slow server?
uptime, then vmstat 1. uptime tells you whether anything is queued by comparing the load average to the core count, and vmstat shows the run queue, swap activity, and disk blocks in one line. Together they point you at CPU, memory, or disk within seconds. From there you follow the evidence with the more specific tools. Starting broad prevents the common mistake of opening a detailed tool for the wrong resource.
How do I know it is disk and not CPU?
Look at the wa field in top and the b column in vmstat. A high load with a large wa, idle CPU, and blocked tasks means processes are waiting on IO, not computing. Confirm with iostat -xz: a saturated device with a rising await settles it. If instead us is high and wa is near zero, it is CPU. The two signatures look nothing alike once you know where to look.
Do I need to run all eight commands every time?
No. The sequence is a funnel. Once a resource is clearly the constraint, stop and drill into it. If vmstat and top show CPU pinned, you jump to mpstat and pidstat for the process and skip the disk tools. The value of listing all eight is that you never forget a resource under pressure. In practice most incidents resolve after the fourth command, with the rest confirming what you already suspect.
Should I check dmesg even if nothing looks broken?
Yes, early. dmesg -T | tail takes a second and catches the causes that masquerade as slowness: a disk throwing IO errors, an OOM kill that took out a service, or a network interface resetting. These do not show up as a busy resource, so the resource tools miss them. Reading the kernel log first means you do not spend ten minutes profiling CPU when the real story is a device that is failing.
What you have, and what comes next
You now have a repeatable triage: eight commands in order, each ruling a resource in or out, ending on the process responsible. You watched it work on a real bottleneck, moving from a load reading to a wa of 54.5 percent, to a saturated sda at 77.92 percent utilisation, to four dd processes named by pidstat. That path, broad to specific to process, is the whole method.
The final chapter covers the storage problems that are not about speed: a full disk with free space, inodes exhausted, deleted files still held open, and the file descriptor limits that quietly cap a busy service.