Why journalctl beats a pile of log files
Every restart in the last chapter landed somewhere you could read it, and that somewhere is the journal. On a systemd server the logs are not a pile of text files; they live in a structured binary journal, and journalctl is how you read it. Each entry carries named fields, not just a line of text, so you can filter by unit, priority, and time without a single grep. This chapter drives journalctl on Ubuntu 24.04 to slice the journal, store it properly, and keep it from growing without bound.
journalctl -u nameshows one unit; add-pfor priority and--sincefor a time window, and they combine.-o json-prettyreveals the structured fields behind each line, which is why the filters are exact and the logs ship cleanly.Storage=persistentplus/var/log/journalkeeps logs across a reboot, so you can read the boot that crashed.journalctl --disk-usagereports size;--vacuum-timeor--vacuum-sizetrims it, touching only sealed archives.
Filtering by unit, priority, and time
The whole journal on a busy server is noise. Three flags cut it down to the entry you want, and they stack. -u name.service limits output to one unit. -p filters by priority using the syslog levels, so -p err shows errors and worse while -p warning widens it to warnings. --since and --until accept plain phrases like "10 min ago" or an absolute timestamp. Chained together, journalctl -u sc-demo-web.service -p warning --since "10 min ago" asks a precise question: warnings or worse from this one service in the last ten minutes.
Two more flags earn their keep daily. -f follows the journal live, the systemd equivalent of tail -f. -n limits the count, so -n 20 shows the last twenty lines, and -o cat strips the timestamp and hostname prefix when you only want the message text, which is exactly what you saw in the last chapter's restart trace.
Reading the structure with JSON
Every line you see is rendered from a record with many fields. Ask for the pretty JSON view and the structure appears.
journalctl -u sc-demo-web.service -n 1 -o json-pretty
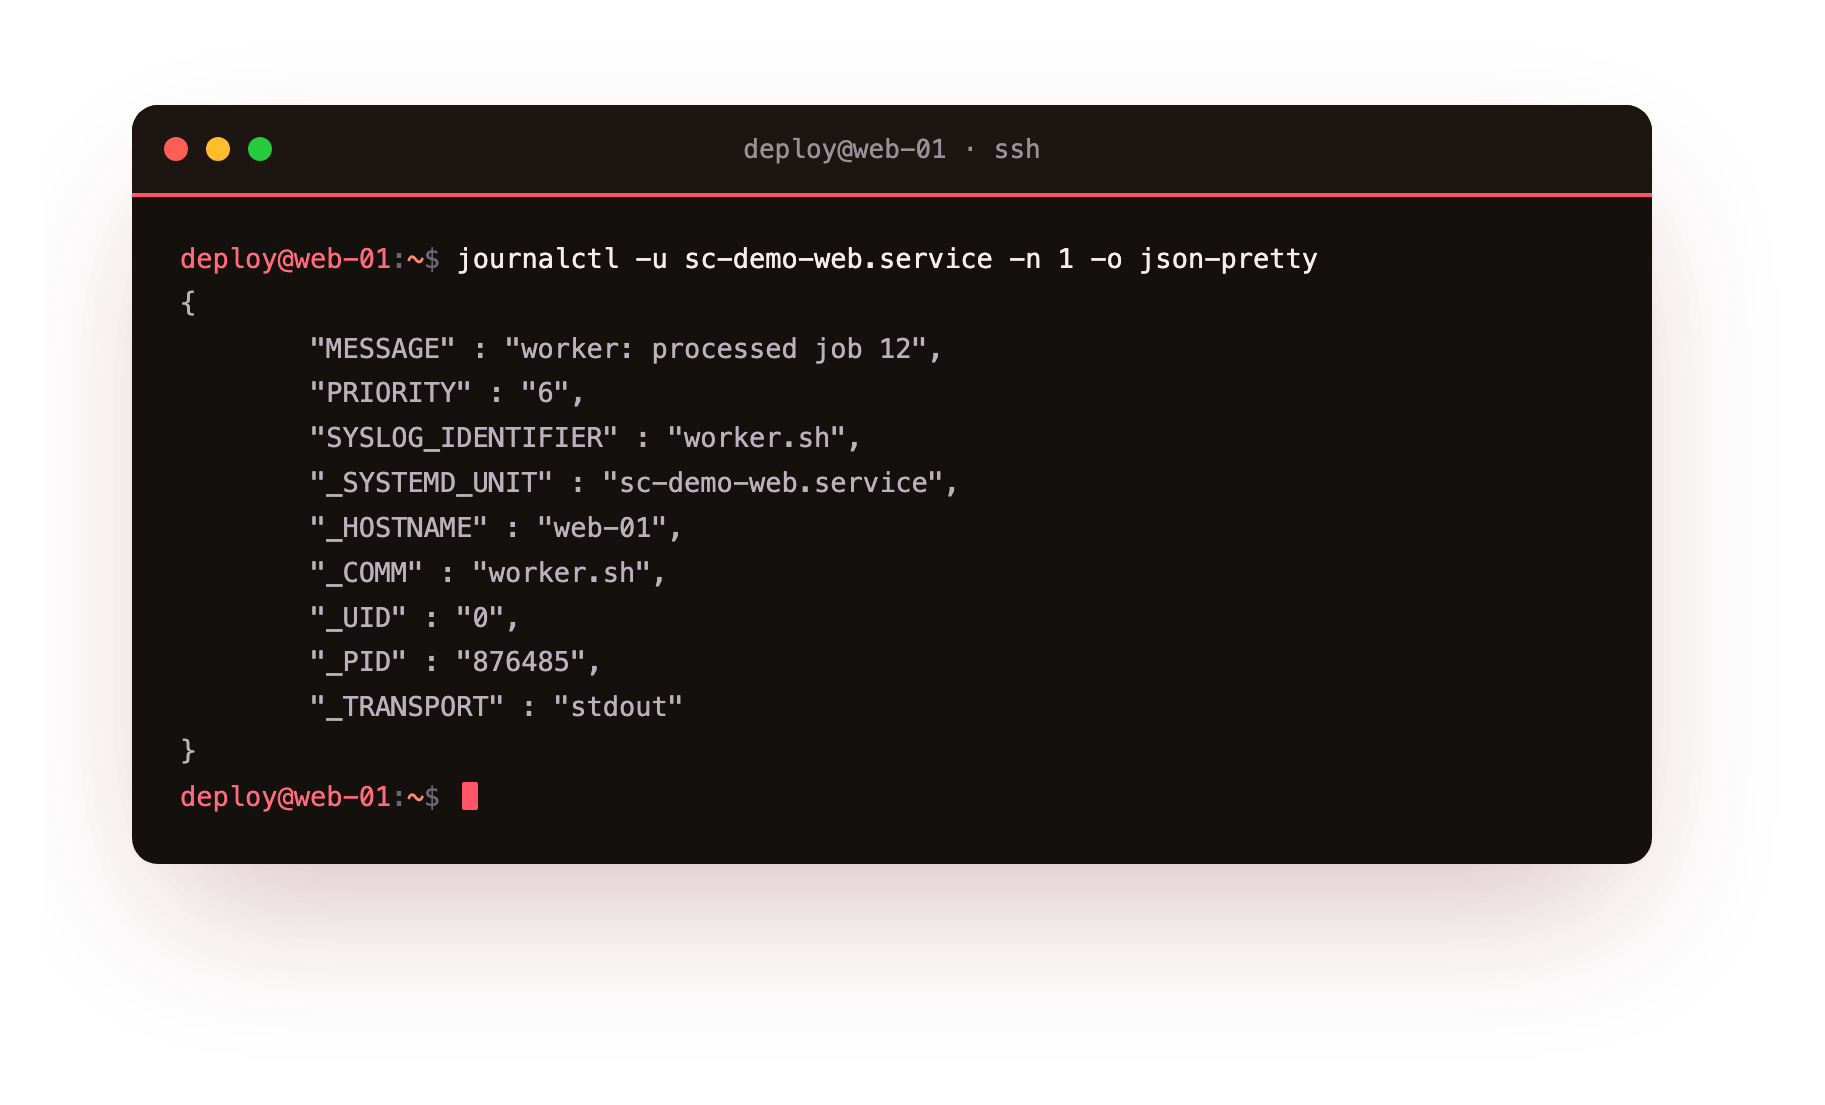
A single entry carries the message, the priority as a number, the unit that produced it, the process ID, the transport it arrived on, and more, each as a named field. The plain -o json output holds the same fields on one compact line for tooling; json-pretty just spaces them out to read.
This structure is why journald filtering is exact rather than a text match: -p, -u, and the rest query fields, not substrings. It is also why the journal ships cleanly, because a log forwarder reads these fields directly, so the priority and unit survive the trip to a central system instead of being re-parsed from a string.
You can filter on any field yourself. journalctl _SYSTEMD_UNIT=nginx.service matches the field directly, and journalctl _UID=33 shows everything a given user ran. To search message text, --grep takes a pattern, so journalctl -u nginx.service --grep "timeout" finds the timeouts in one service without piping through grep.
Compare journalctl -u sc-demo-web.service -n 1 with the same command plus -o json-pretty. The first is one readable line; the second is the same event with every field named. If you plan to ship logs anywhere, the JSON form is what makes priority and unit survive the trip.
Making the journal persistent
By default some systems keep the journal under /run, which is memory, so it is wiped on every reboot. That is fine for a laptop and wrong for a server you need to investigate after a crash. The Storage= setting in /etc/systemd/journald.conf controls this. The default is auto, which becomes persistent only if the directory /var/log/journal already exists.
sudo mkdir -p /var/log/journal
sudo systemctl restart systemd-journald
Creating that directory and restarting the journal daemon is enough; setting Storage=persistent explicitly makes the intent obvious to the next person. From then on the journal survives reboots, and journalctl --boot -1 reads the previous boot. On many cloud images /var/log/journal is already present, so check first with ls -d /var/log/journal before assuming your logs vanish at reboot.
Keeping the journal from filling the disk
A persistent journal grows, and left alone it can crowd a small disk. Two limits keep it in check. SystemMaxUse= in journald.conf caps the total size, and journald also enforces a rate limit through RateLimitIntervalSec and RateLimitBurst so a chatty service cannot flood the log. Start by reading how much space the journal uses now.
journalctl --disk-usage
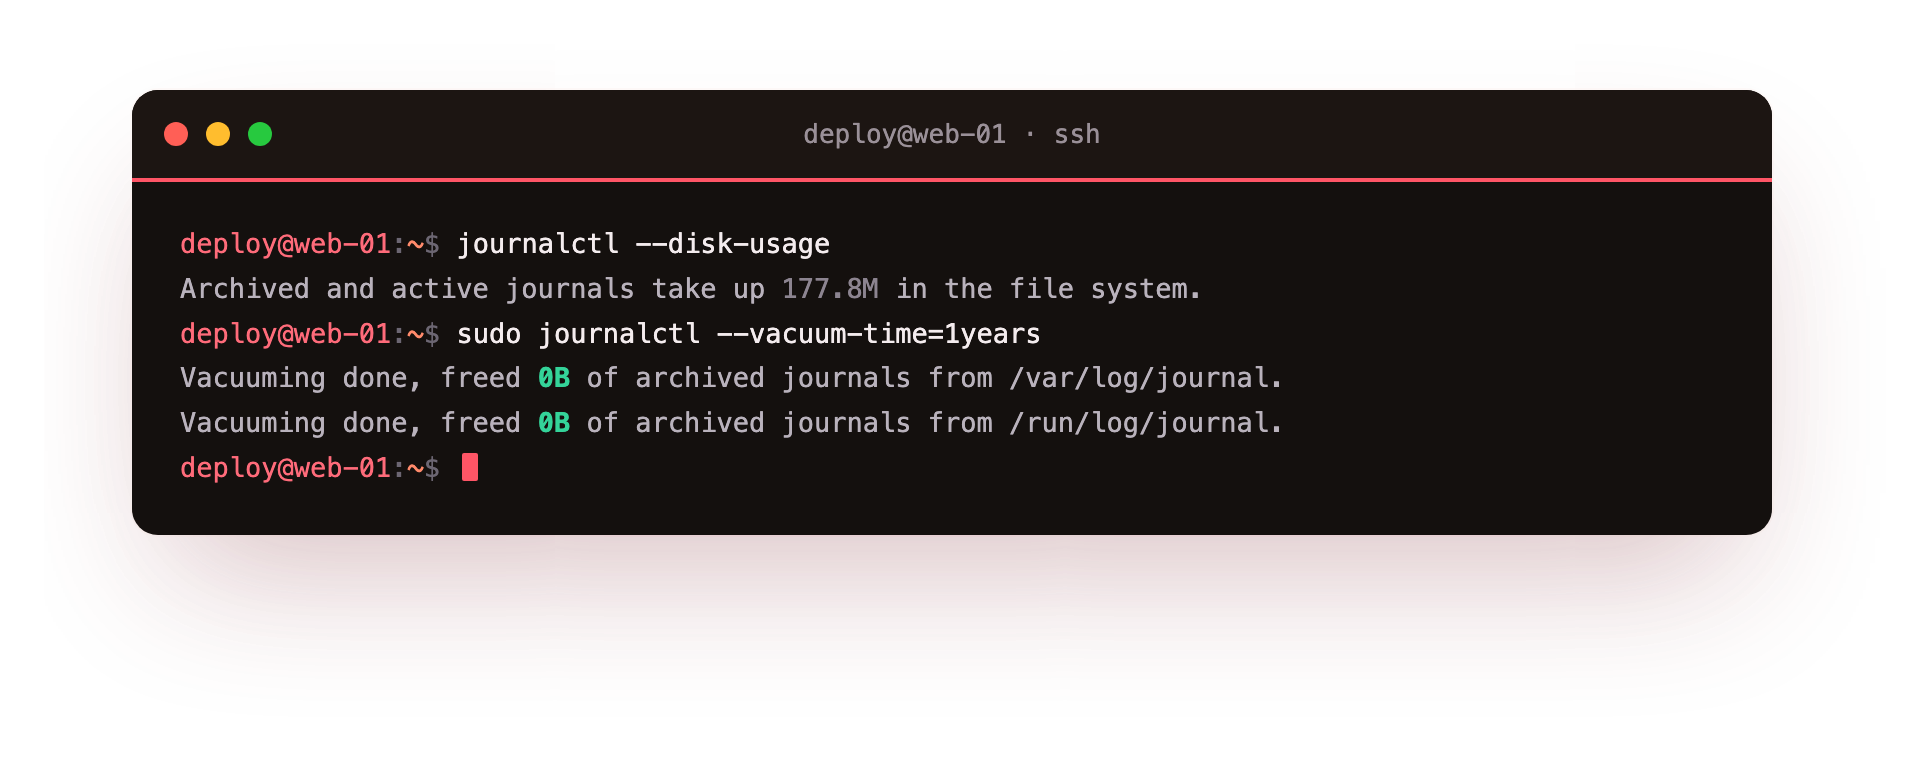
When you need to reclaim space, vacuum by age or by size. --vacuum-time=1years removes archived journals older than a year, and --vacuum-size=500M trims the oldest until the total fits. Both operate on sealed archive files and never the active one, so a vacuum is safe to run on a live server, and the command reports exactly what it freed from each journal directory, which keeps the operation honest.
Run journalctl --disk-usage to see the current size, then a --vacuum-time that is safely in the past, such as one year. If nothing is that old it frees 0B and touches nothing, which is exactly what you want to see before trusting a tighter vacuum on a real box.
Reading logs from a single boot
Investigating an incident usually means reading one boot, not the whole history. journalctl --list-boots prints every boot the journal remembers with an index. journalctl -b shows the current boot, and journalctl -b -1 shows the one before it, which is what you want after an unexpected reboot. Combine it with a unit filter, for example journalctl -b -1 -u nginx.service, to read one service across one boot. This only works when the journal is persistent, which is the reason the previous section matters.
Frequently asked questions
Are journald and rsyslog both running?
Often yes. journald is always present; some servers also run rsyslog to write classic /var/log files or forward off-box. You can rely on journald alone and drop rsyslog if nothing needs the text files.
Does a persistent journal wear out an SSD?
Not in practice. The write volume is small next to normal server activity, and SystemMaxUse= caps the total. The investigative value after a crash far outweighs the modest writes.
Why does journalctl show fewer lines than my app logged?
The rate limiter dropped the surplus, and journald notes how many it suppressed. Raise RateLimitBurst or widen RateLimitIntervalSec in journald.conf for a legitimately chatty service.
How do I export logs for a support ticket?
Run journalctl -u name --since today -o export > unit.journal for the native format, or -o json for tooling. Both preserve the fields, so priority and unit stay intact on the other end.
What you can do now
You can query the journal like a database instead of grepping text: narrow to a unit with -u, a priority with -p, and a window with --since, and read the named fields behind any line with -o json-pretty. You can make the journal survive a reboot by creating /var/log/journal, watch its size with --disk-usage, and trim it with a vacuum that only ever touches sealed archives.
So far every service you have run started when you told it to. Plenty of work should instead run on a schedule: a nightly report, a health check every few minutes, a cleanup after boot. The next chapter replaces cron with systemd timers, which log into the journal you just learned to read and catch up a run they missed: systemd timers versus cron.