The query you never notice until the whole box slows down
The slow query log is the one tool that turns a vague "the site feels heavy" into a named line you can read, time, and fix. This chapter switches it on, runs a query slow enough to be caught, reads the recorded entry, then uses EXPLAIN to see why the query is slow and the live status counters to watch health. Every step runs on a real MariaDB on Ubuntu 24.04, with the actual numbers the server produced.
- long_query_time sets the threshold in seconds, and any statement that runs longer than it lands in the slow query log automatically.
- A recorded entry gives you Query_time, Rows_examined, and the exact SQL, which is enough to know where to look next.
- EXPLAIN turns the slow line into a reason: a full scan, a join buffer, or a missing index show up as plain text.
- SHOW PROCESSLIST and SHOW GLOBAL STATUS are the live view, telling you what runs now and how many queries have already crossed the line.
Slow databases rarely announce themselves. One report loads a second late, then two seconds, then a support ticket arrives, and by then the cause is buried under a week of ordinary traffic. Guessing which query is the culprit wastes an afternoon. Measuring it takes a minute.
The loop this chapter teaches is short and repeatable: find the slow statement in the log, explain it to learn the cause, fix it with an index or a rewrite, then watch the counters to confirm the fix held. You do not need a dashboard to start. You need the log turned on and the patience to read one entry properly.
Let's build.
Prerequisites
- A running MariaDB on an Ubuntu 24.04 LTS server, from the install chapter earlier in this series.
- Shell access with a sudo user that can run the mariadb client as the system root.
- A sample database with enough rows to make a query take real time, here a shopdb with a 20,000-row orders table.
- Enough familiarity with SQL to read a SELECT, a JOIN, and the output of EXPLAIN.
Turn on the slow query log
The slow query log is off by default on most installs, so nothing is recorded until you enable it. You can switch it on at runtime without restarting the server, which is the quick way to start catching problems right now.
SET GLOBAL slow_query_log = ON;
SET GLOBAL long_query_time = 1;
SET GLOBAL log_output = 'FILE';
Here long_query_time is the threshold in seconds. Any statement that runs longer than one second is written to the log, and faster statements are ignored so the file stays readable. Setting log_output to FILE sends entries to a plain text file rather than a table. The default file on this server is /var/log/mysql/mariadb-slow.log.
These settings reset when the server restarts. To make them permanent, add slow_query_log and long_query_time to a config file under /etc/mysql/mariadb.conf.d/, for example in a [mysqld] block, so the log survives a reboot without a manual step.
Run a slow query and read the entry
A threshold is only useful if something crosses it. This query joins the orders table to itself on the qty column, which sounds harmless and is not. Run it, then read the last few lines the log recorded.
sudo mariadb shopdb -e "SELECT COUNT(*) AS pairs FROM orders a JOIN orders b ON a.qty = b.qty;"
sudo tail -6 /var/log/mysql/mariadb-slow.log
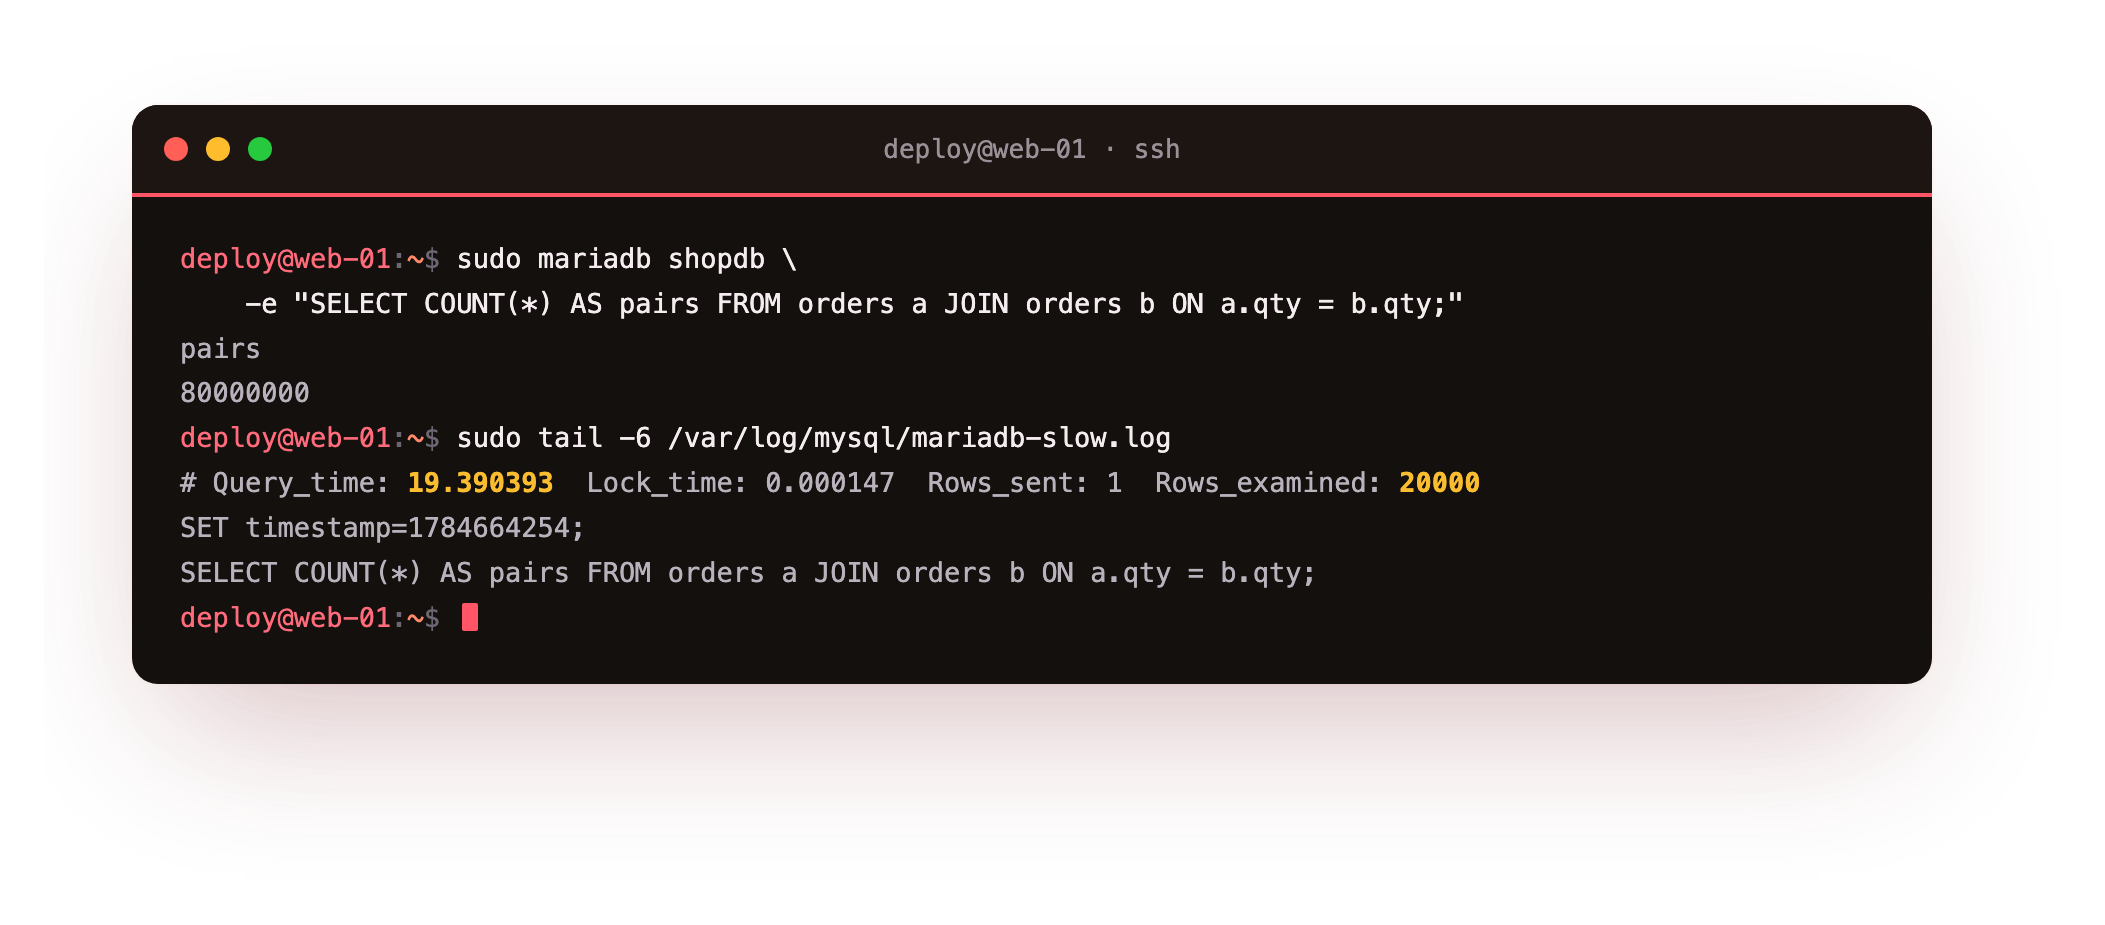
The query returns 80000000, and the log records a line reading # Query_time: 19.390393 Lock_time: 0.000147 Rows_sent: 1 Rows_examined: 20000, followed by the SELECT text itself. The qty column holds only a few distinct values, so joining the 20,000-row table to itself on qty explodes into tens of millions of row comparisons.
That is why the statement takes over 19 seconds. This is a genuinely slow query, not an artificial sleep, and the entry gives you everything to act on: the time it cost, the rows it touched, and the exact SQL to investigate next.
The tail of the log should hold a block with a Query_time above your threshold and the offending SELECT printed underneath it. If the file stays empty after a query you know was slow, the log is not on, so confirm slow_query_log reads ON and that long_query_time is not set higher than the query you just ran.
Use EXPLAIN to see why it is slow
The log tells you a query was slow. EXPLAIN tells you the reason. Ask the server how it plans to run the same statement, without the COUNT wrapper getting in the way of the plan.
sudo mariadb shopdb -e "EXPLAIN SELECT COUNT(*) FROM orders a JOIN orders b ON a.qty = b.qty;"
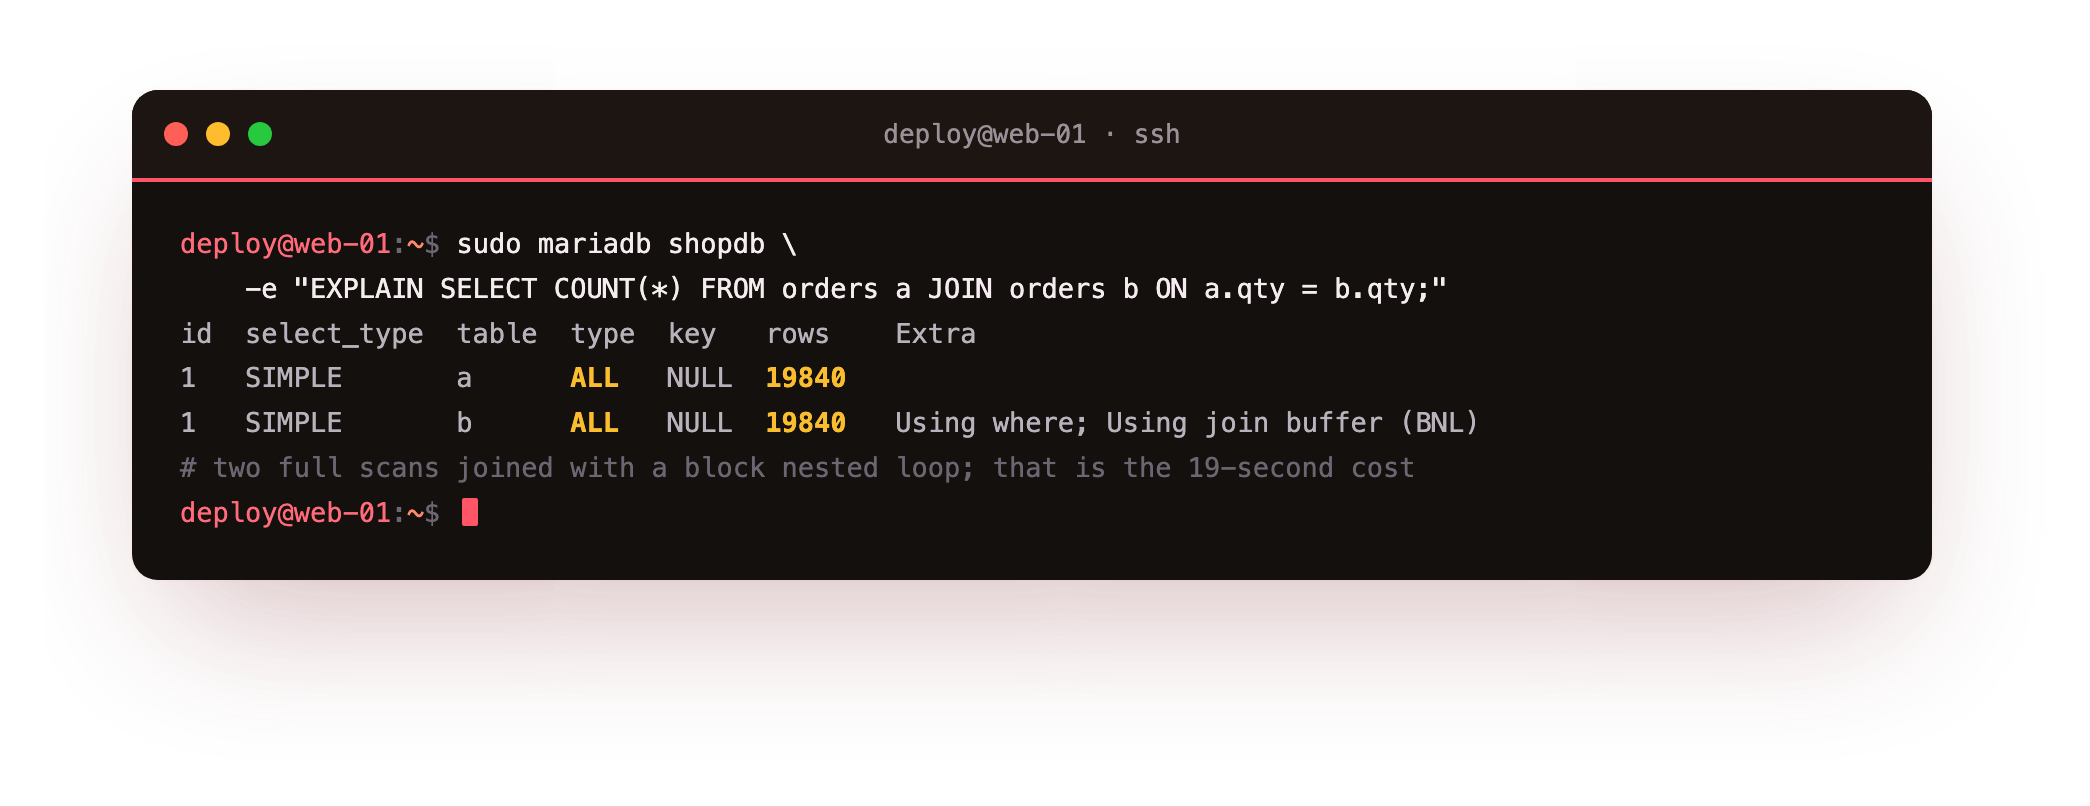
The output is two rows, both showing type of ALL and rows of 19840. The second row adds an Extra of Using where; Using join buffer (flat, BNL join). Type ALL means a full table scan, so the server reads every row of both copies of the table.
Two full scans stitched together with a block nested loop join is the 19-second cost, spelled out. The fix follows from the plan: index the join column so the second table can be looked up instead of scanned, or rewrite the query so it does not multiply rows in the first place. EXPLAIN does not fix anything, but it points at exactly one thing to change.
Watch live health with status and process list
The log and EXPLAIN are for queries that already ran. To see the server right now, and to count how many statements have crossed the threshold since startup, read the global status counters and the live process list.
sudo mariadb -e "SHOW GLOBAL STATUS WHERE Variable_name IN ('Slow_queries','Threads_connected','Threads_running','Questions');"
sudo mariadb -e "SHOW PROCESSLIST;"
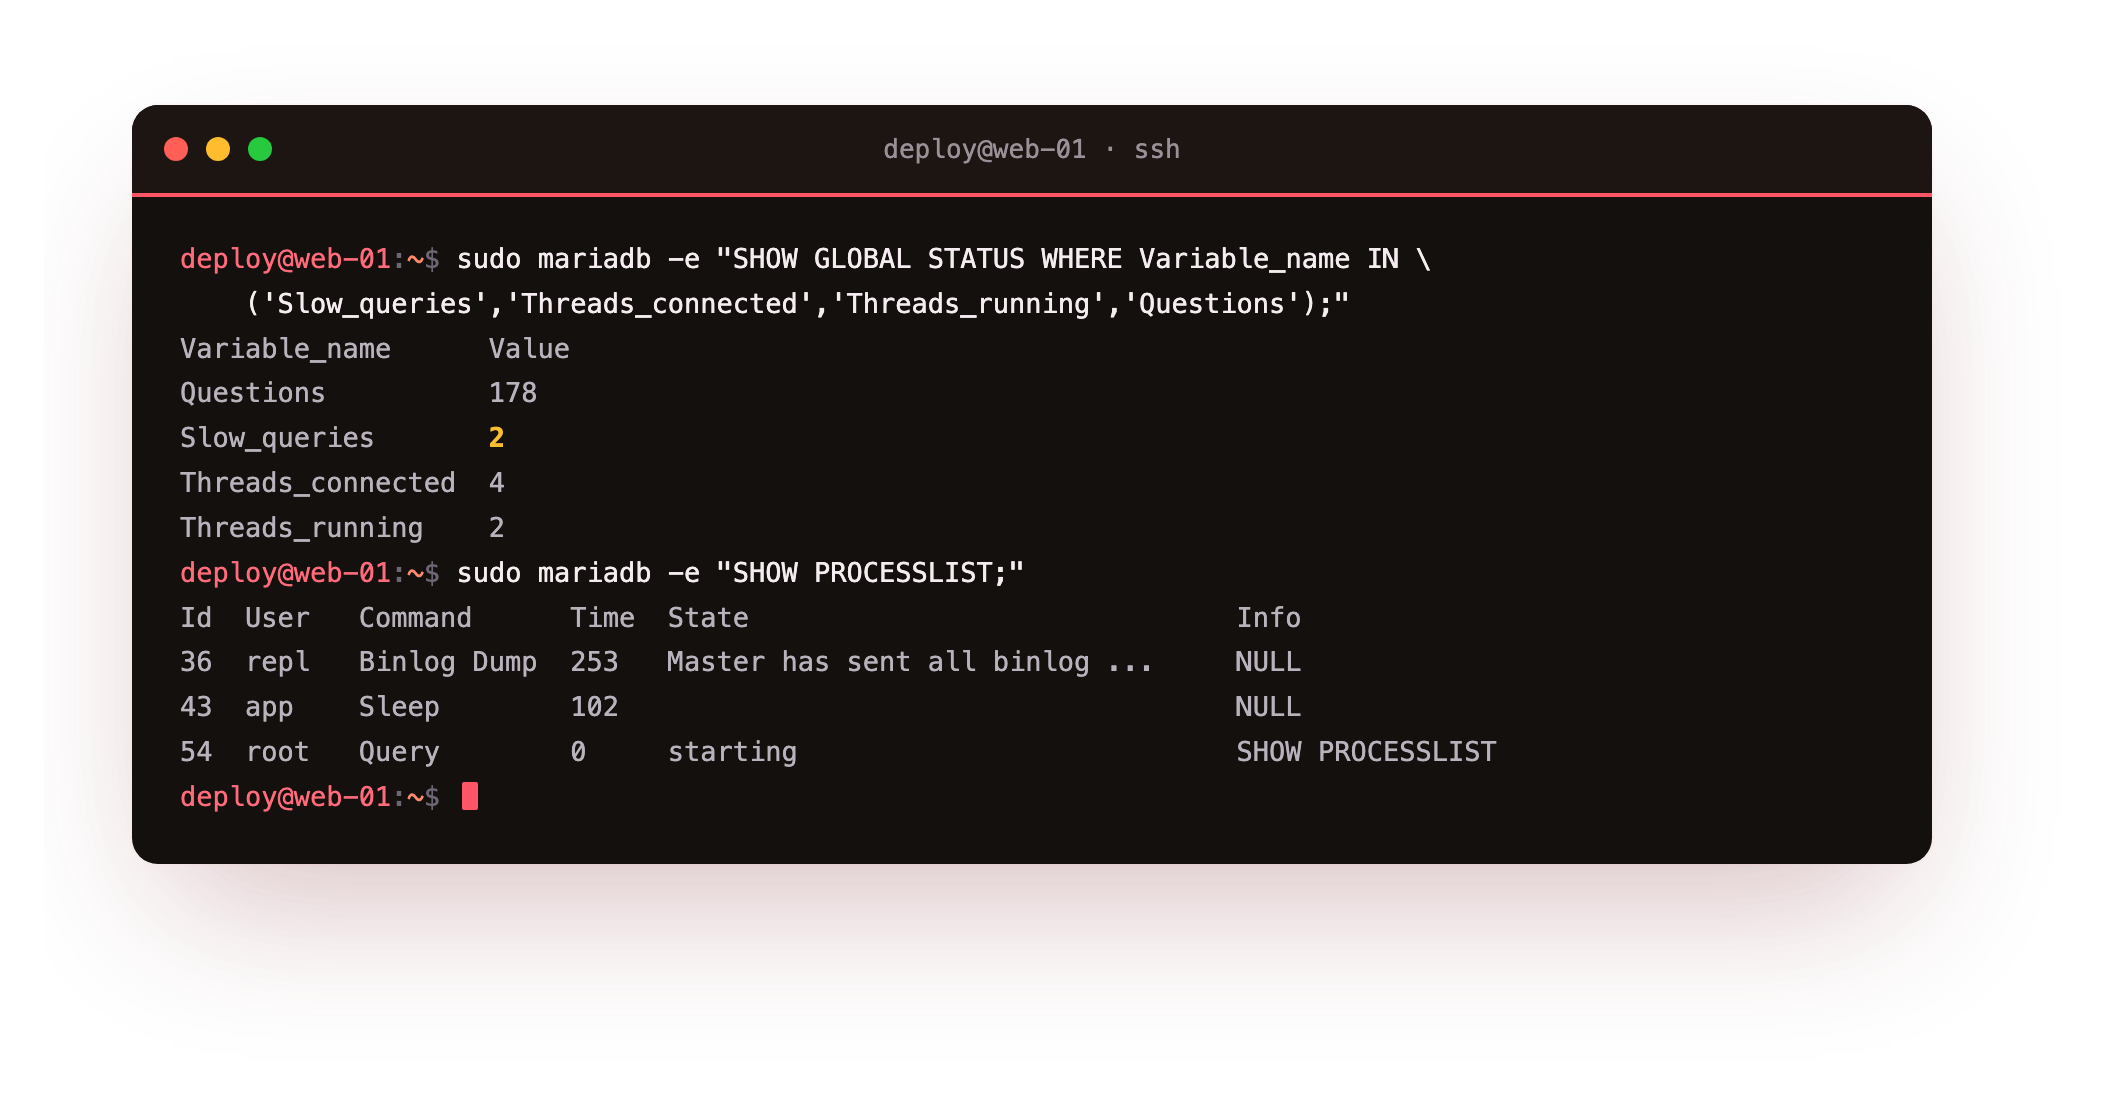
On this server GLOBAL STATUS reports Questions 178, Slow_queries 2, Threads_connected 4, and Threads_running 2. Slow_queries is a running count of statements that crossed long_query_time, so a number that climbs fast tells you the log is filling and something needs attention.
SHOW PROCESSLIST is the live x-ray of what every connection is doing. Here it lists a replication Binlog Dump thread, an app connection sitting in Sleep, and the root connection running SHOW PROCESSLIST itself. A query stuck in one State with a large Time value is the thing to investigate first, because it is holding resources while you read.
Together these four steps are the loop: find the statement in the slow query log, explain it to learn the cause, fix it with an index or a rewrite, then watch the counters and the process list to confirm the fix held. Run the loop whenever the box feels heavy, not once a year.
Troubleshooting monitoring
The slow log file stays empty. Confirm the log is on with SHOW VARIABLES LIKE 'slow_query_log'; and check that long_query_time is not set higher than any query you run. If output went to a table, set log_output back to FILE and look at /var/log/mysql/mariadb-slow.log again.
The log grows too fast to read. Your threshold is probably too low, or a batch job is firing many borderline queries. Raise long_query_time to 2 or more so only the real offenders land, and consider rotating the file so a single capture does not consume the disk.
EXPLAIN shows type ALL but the query still feels fine. A full scan on a tiny lookup table is cheap and normal. Type ALL only matters on large tables or inside joins, where it multiplies. Judge it against the Rows_examined number from the slow log, not on its own.
For a summary across many entries, reach for a digest tool. Reading the raw log by hand is fine for one query, but pt-query-digest or a mariadb-slow-query summary groups entries and ranks them by total time, which is a useful optional next step once the log holds a week of data.
Frequently asked questions
Where does MariaDB write the slow query log on Ubuntu 24.04?
With log_output set to FILE, entries go to /var/log/mysql/mariadb-slow.log by default. You can change the path with the slow_query_log_file setting, but the default location works and sits next to the error log, so both are in one place when you investigate an incident.
Does turning on the slow query log slow the server down?
The overhead is small when long_query_time is a second or more, because only statements that already ran slowly get written. The cost matters only if you set the threshold to 0 and log everything, which is why that setting is for short capture windows and not for normal running.
What is the difference between Rows_sent and Rows_examined?
Rows_sent is how many rows the query returned to the client. Rows_examined is how many rows the server read to produce that result. A large gap between them, such as 20,000 examined for one row sent, is a strong sign the query needs an index or a rewrite.
How do I fix a query that EXPLAIN shows as a full scan?
Add an index on the column used in the join or WHERE clause so the server can look rows up instead of reading the whole table. If an index does not help because the query multiplies rows, rewrite the logic to aggregate or filter earlier. Then rerun EXPLAIN to confirm type changed from ALL.
What you have, and what comes next
You can now switch on the slow query log, catch a statement that takes real time, read why it is slow from EXPLAIN, and watch the live counters and process list to confirm the server is healthy. That loop turns a slow database from a mystery into a short list of named queries to fix. For metrics beyond the database itself, pair this with the metrics and monitoring with Prometheus guide to graph the same numbers over time.
Monitoring shows you what is happening. The next and final chapter closes the doors on who can reach the database at all, tightening user privileges, network exposure, and audit logging before the server carries production traffic. Continue to security hardening.