A layered approach to linux network troubleshooting
A service feels slow, and the temptation is to guess: restart something, blame the database, or reach for the heaviest tool you know. Linux network troubleshooting works better when you test the layers in order, from the network up to the application, and stop at the first one that is broken.
- Test the layers in order, network then DNS then application, and stop at the first that fails.
- Each layer depends on the ones under it, so a DNS fault can masquerade as application slowness.
- ping checks reachability, resolvectl checks name resolution, curl checks the HTTP response.
- curl's `-w` timing output turns a vague "it is slow" into a number you can point at.
Each layer depends on the ones under it, so a name that will not resolve makes an application look slow when the real fault is DNS. You are logged in as deploy, and the tools below need no sudo for read-only checks.
Here is the order to walk, top of the list first:
- Is the host reachable at the network level? Test with ping.
- Does the name resolve to an address, and how quickly? Test with resolvectl.
- Does the application answer, and with what status? Test with curl and read the HTTP code.
- If it answers but slowly, where is the time going? Break it down with curl's timing output.
Work down this list and you replace one vague "it is slow" with a specific layer that is at fault.
Layer one: is the host reachable
Start at the bottom. If packets cannot reach the host at all, nothing above matters. Send a few ICMP packets with ping -c 3 example.com, where -c sets the count so it stops on its own. Steady replies with 0% loss mean the network path is fine and you move up a layer.
Heavy loss or no reply means you have a network or routing problem to solve before you look at the application, though remember that some hosts drop ICMP by policy and a silent ping alone is not proof the host is down.
Does the name resolve?
The next layer up is name resolution. An address that resolves slowly, or resolves to the wrong place, shows up as application slowness even though the application is healthy. On Ubuntu 24.04 the system resolver is systemd-resolved, and you query it directly with resolvectl rather than guessing what the application received:
resolvectl query example.com | head -1
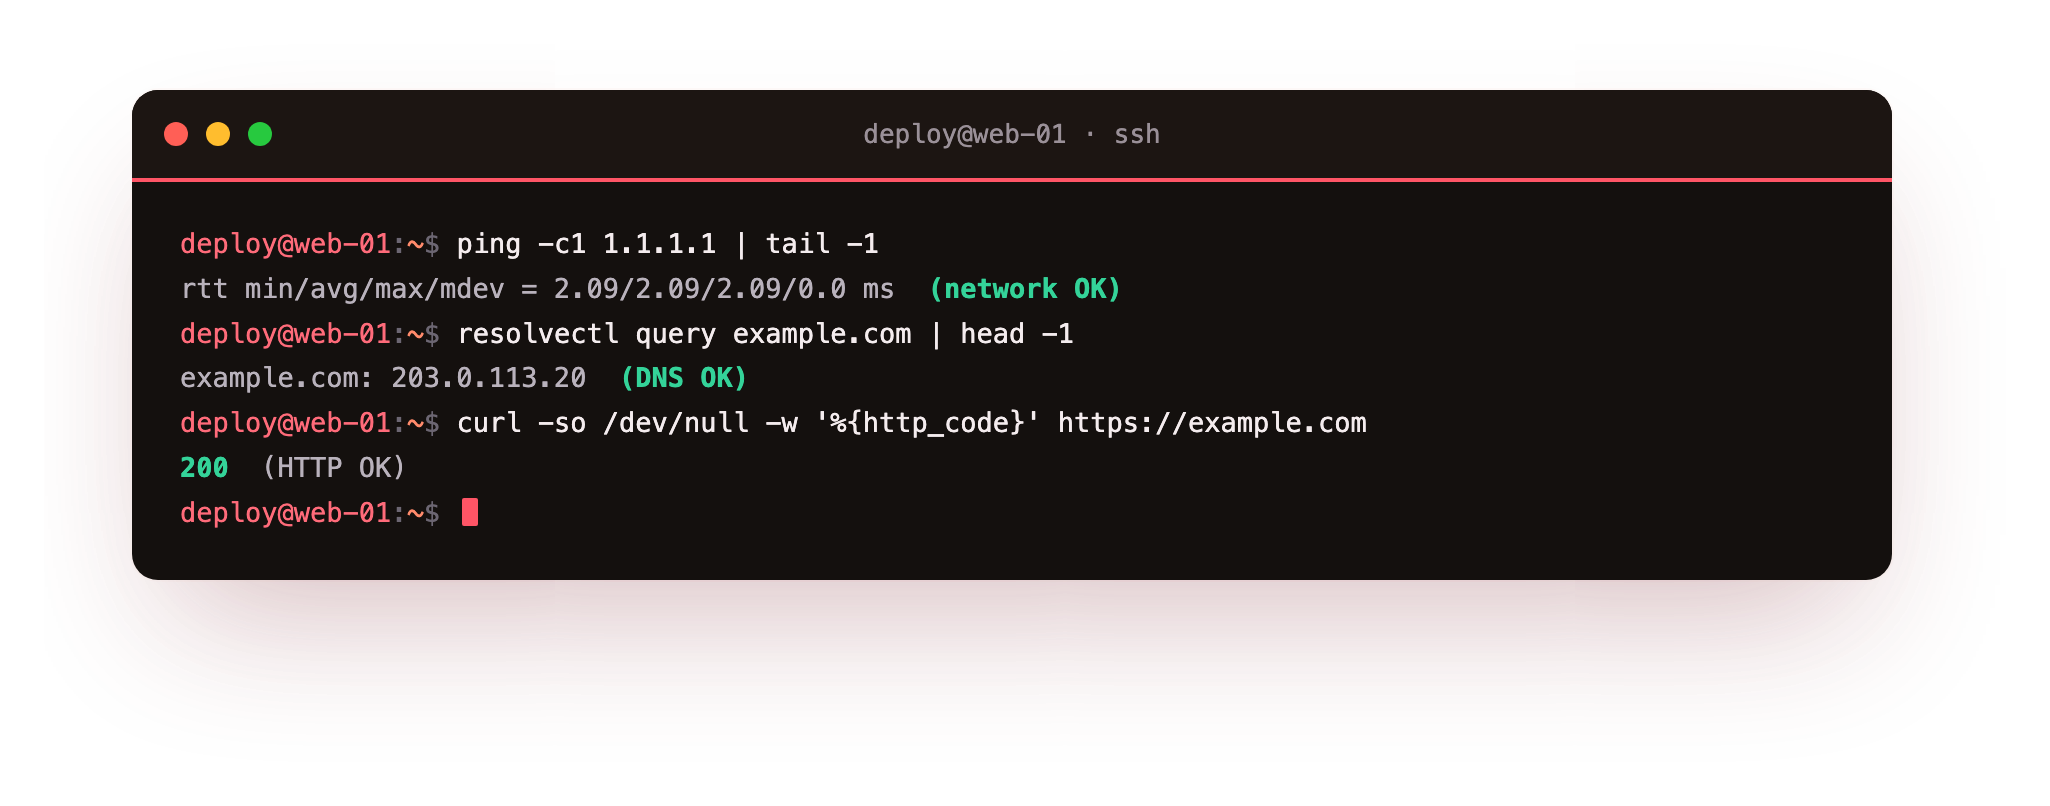
resolvectl query asks the system resolver to look up example.com and prints the addresses it gets back, along with whether the answer came from the cache or a live lookup. Piping to head -1 keeps only the first line, which is the name and its resolved address, so you confirm at a glance that the name maps to the address you expect.
If this is slow or returns nothing, your problem is DNS, not the application, and that is where to dig next. Point at a specific resolver to compare, for instance testing 1.1.1.1, and you can tell a broken local resolver apart from a broken record.
Does the application answer, and how fast
Once the host is reachable and the name resolves, ask the application itself. curl is the tool for this because it speaks HTTP and reports exactly what came back. Run curl -o /dev/null -s -w '%{http_code}\n' https://example.com. The -o /dev/null flag throws away the response body, -s silences the progress meter, and -w prints only the fields you name, here %{http_code}, the HTTP status the server returned.
A 200 means the application answered normally; a 500 points at the application, a 502 or 504 at something sitting in front of it, and a stall with no code at all sends you back down to the DNS or network layers.
Where the time actually goes
A status code tells you the request worked, not why it was slow. curl's -w flag can print a full timing breakdown, so you see which stage of the request ate the seconds. Feed it a format string of timers, for example curl -o /dev/null -s -w 'dns %{time_namelookup} connect %{time_connect} tls %{time_appconnect} total %{time_total}\n' https://example.com. Each value is the seconds elapsed up to that stage:
| Timer | Measures up to |
|---|---|
| time_namelookup | the DNS name was resolved |
| time_connect | the TCP connection was made |
| time_appconnect | the TLS handshake finished |
| time_total | the whole response was received |
Read them as a growing sequence. If time_namelookup is large, DNS is your cost. If the jump from connect to total is large, the server is slow to generate the response. This is the moment linux network troubleshooting turns from an opinion into a number you can point at.
Frequently asked questions
Why test the network before the application?
Because each layer sits on the ones below it. If packets cannot reach the host or a name will not resolve, the application looks slow when the real fault is lower down. Testing bottom-up stops you debugging code that was never the problem.
How do I tell a DNS problem from an application problem?
Query the name directly with resolvectl query example.com. If that is slow or fails, the fault is DNS. If the name resolves quickly but curl returns a 500 or stalls, the problem is the application or something in front of it.
What does a 502 or 504 status point to?
Something sitting in front of the application, usually a reverse proxy or load balancer that could not get a good answer from the backend. A 500 points at the application itself, while no status code at all sends you back to the DNS and network layers.
Which curl timer shows a slow DNS lookup?
time_namelookup, the seconds elapsed until the name was resolved. If it is large, DNS is your cost. If the gap between time_connect and time_total is large instead, the server is slow to generate the response.
Recap
When something is slow, resist the guess and test the layers in order. ping shows whether the host is reachable at the network level. resolvectl query confirms the name resolves and how quickly, catching DNS faults that masquerade as application slowness.
curl with -w '%{http_code}' shows whether the application answers and with what status, and curl's fuller timing format breaks the request into named stages so you can see exactly where the seconds go. That short checklist is the whole of linux network troubleshooting for a slow service: start at the network, climb to the application, and stop at the first layer that fails.