Where are the logs actually stored?
You restart the sc-demo worker, it fails, and your first instinct is to open a log file in /var/log. On a systemd server that file often is not there. systemd collects the output of every service into one structured store called the journal, and you read it with journalctl. Learning to query journalctl systemd logs well is the difference between guessing why a service failed and reading the exact line where it did.
- systemd stores service output in the journal, a structured binary store, not a flat log file.
- Read one service with
journalctl -u name, and trim volume with-nfor the last N lines. - Follow new lines live with
-f, the journal's version oftail -f. - Bound a time window with
--sinceand--until, and filter severity with-p.
The journal is not a plain text file you can tail. It is a binary, indexed store that records each entry with metadata: which unit produced it, the timestamp, the priority, the PID. That structure is what lets you slice the same stream by unit, by time, or by severity without stringing together grep pipelines.
One practical note before the flags: reading another service's logs can need extra rights. Membership in the adm or systemd-journal group lets a normal user read the full journal, and on a typical server the deploy user is already in adm. If a query comes back empty when you expect lines, check your groups with the groups command before you assume the service wrote nothing.
Prerequisites
- An Ubuntu 24.04 LTS server running at least one systemd service to inspect, such as
sc-demo. - Membership in the
admorsystemd-journalgroup to read other services' logs (see Users and Permissions). Confirm it with thegroupscommand.
Reading journalctl systemd logs for one unit
By default journalctl shows every message from every service, oldest first, which is rarely what you want. The -u flag, short for unit, filters to a single service:
journalctl -u sc-demo
That still prints the whole history for sc-demo, which can run to thousands of lines. Two more flags trim it. -n limits output to the last N entries, and -o cat changes the output format to bare message text with no timestamp or hostname prefix, which helps when you only care what the program said:
journalctl -u sc-demo -n 3 -o cat
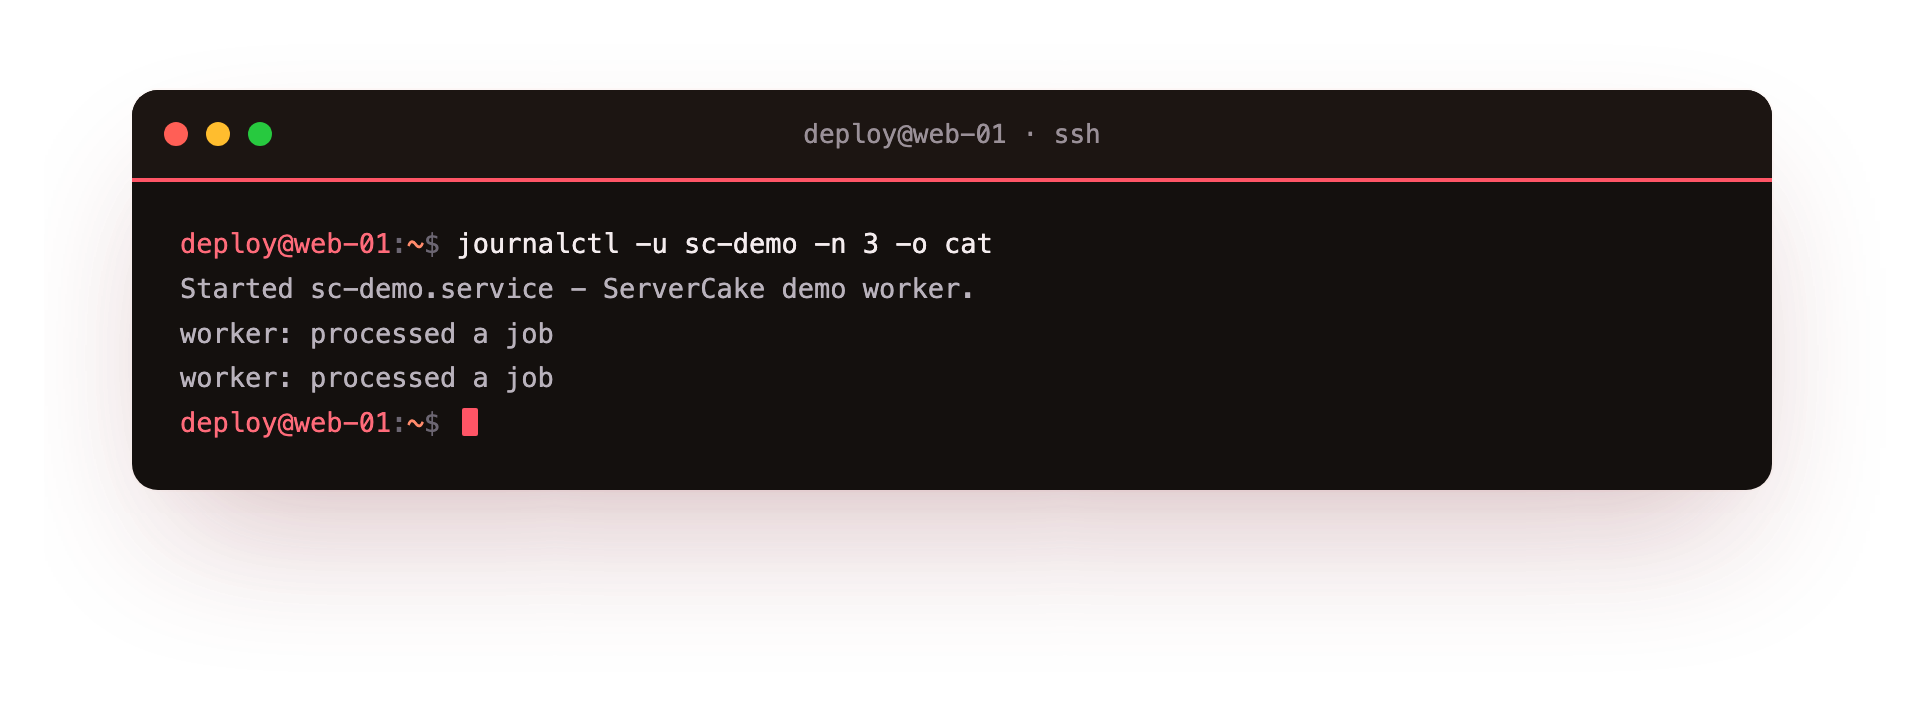
This shows the last three messages from the worker as plain lines, so you should see its "worker: processed a job" text with nothing else around it.
Following logs live with -f
When you are restarting a service and want to watch what it does, -f, short for follow, streams new entries as they arrive, the same idea as tail -f on a file:
journalctl -u sc-demo -f
The command does not return to your prompt. It sits and prints each new line as the worker emits it. Press Ctrl+C to stop watching. Pair it with -u so you follow only the service you care about instead of the whole system. This is the view to keep open in a second terminal while you deploy, so you see the worker go down, come back up, and start logging again as it happens.
Narrowing by time with --since
Log history piles up, and "show me everything" is too much when you know roughly when a problem started. --since takes a time and shows only entries after it. It understands both absolute stamps and plain words:
journalctl -u sc-demo --since "10 minutes ago"
journalctl -u sc-demo --since "2026-07-15 09:00:00"
There is a matching --until flag to close the window at the top end. Together they pull out exactly the slice around an incident.
Filtering by severity with -p
Every entry carries a syslog priority, from 0 (emergency) up to 7 (debug). -p, short for priority, shows entries at that level and everything more severe. To see only warnings and worse from the worker:
journalctl -u sc-demo -p warning
The named levels you will reach for most:
| Priority | Name | Meaning |
|---|---|---|
| 3 | err | the service reported an error |
| 4 | warning | something looks off but it kept running |
| 6 | info | normal operational messages |
Asking for -p err hides the routine "processed a job" chatter and leaves only the lines that point at a fault.
Putting the flags together
The flags stack, and that is the real point of journalctl systemd logs. A single command can say "errors from sc-demo in the last hour, as plain text":
journalctl -u sc-demo -p err --since "1 hour ago" -o cat
A short summary of the flags covered here:
- -u NAME: only this unit
- -n N: only the last N lines
- -f: follow new lines live
- --since and --until: bound a time window
- -p LEVEL: this priority and everything more severe
- -o cat: bare message text, no prefixes
On Ubuntu 24.04 the journal persists across reboots by default, so these queries reach back past the last restart rather than starting fresh each boot.
Troubleshooting an empty or missing journal
journalctl -u returns nothing. Either the unit name is wrong or you lack rights to read it. Confirm the exact name with systemctl status, and check you are in the adm or systemd-journal group with groups.
"No journal files were found." Persistent storage may be off. On Ubuntu 24.04 it is on by default; if not, create /var/log/journal and run sudo systemctl restart systemd-journald.
The journal only shows the current boot. You are filtering to this boot, or storage is volatile. Use journalctl -u name -b -1 for the previous boot, and confirm /var/log/journal exists for history across reboots.
The journal has grown very large. Check usage with journalctl --disk-usage, then trim it with sudo journalctl --vacuum-time=7d or --vacuum-size=500M.
Frequently asked questions
Where does journalctl read its logs from?
From the systemd journal, a structured store under /run/log/journal or /var/log/journal, not from plain files in /var/log. Each entry carries its unit, timestamp, priority, and PID as metadata.
How do I watch a service's logs in real time?
Run journalctl -u name -f. It streams each new line as the service emits it and does not return to your prompt until you press Ctrl+C.
Do journal logs survive a reboot?
On Ubuntu 24.04 the journal is persistent by default, so queries reach back past the last restart. If storage is set to volatile, logs are kept only for the current boot.
How do I see only errors from a service?
Add -p err, which shows that priority and everything more severe. Combine it with -u name and --since to pull errors from one service in a set time window.
Recap
systemd keeps service output in the journal, a structured store you read with journalctl rather than a flat file in /var/log. Filter to one service with -u, cut the volume with -n, and watch live with -f. Bound the time range with --since and --until, and use -p to keep only entries at a severity you care about. Read journalctl systemd logs with a couple of those flags combined and most "why did it break" questions answer themselves in one line.